
November 2026 - Product Updates
Cost & Usage Explorer 2.0 💫
A complete structural redesign of Cost & Usage Explorer, built to help you analyze deeper, move faster, and uncover insights more easily - packed with powerful new functionalities.
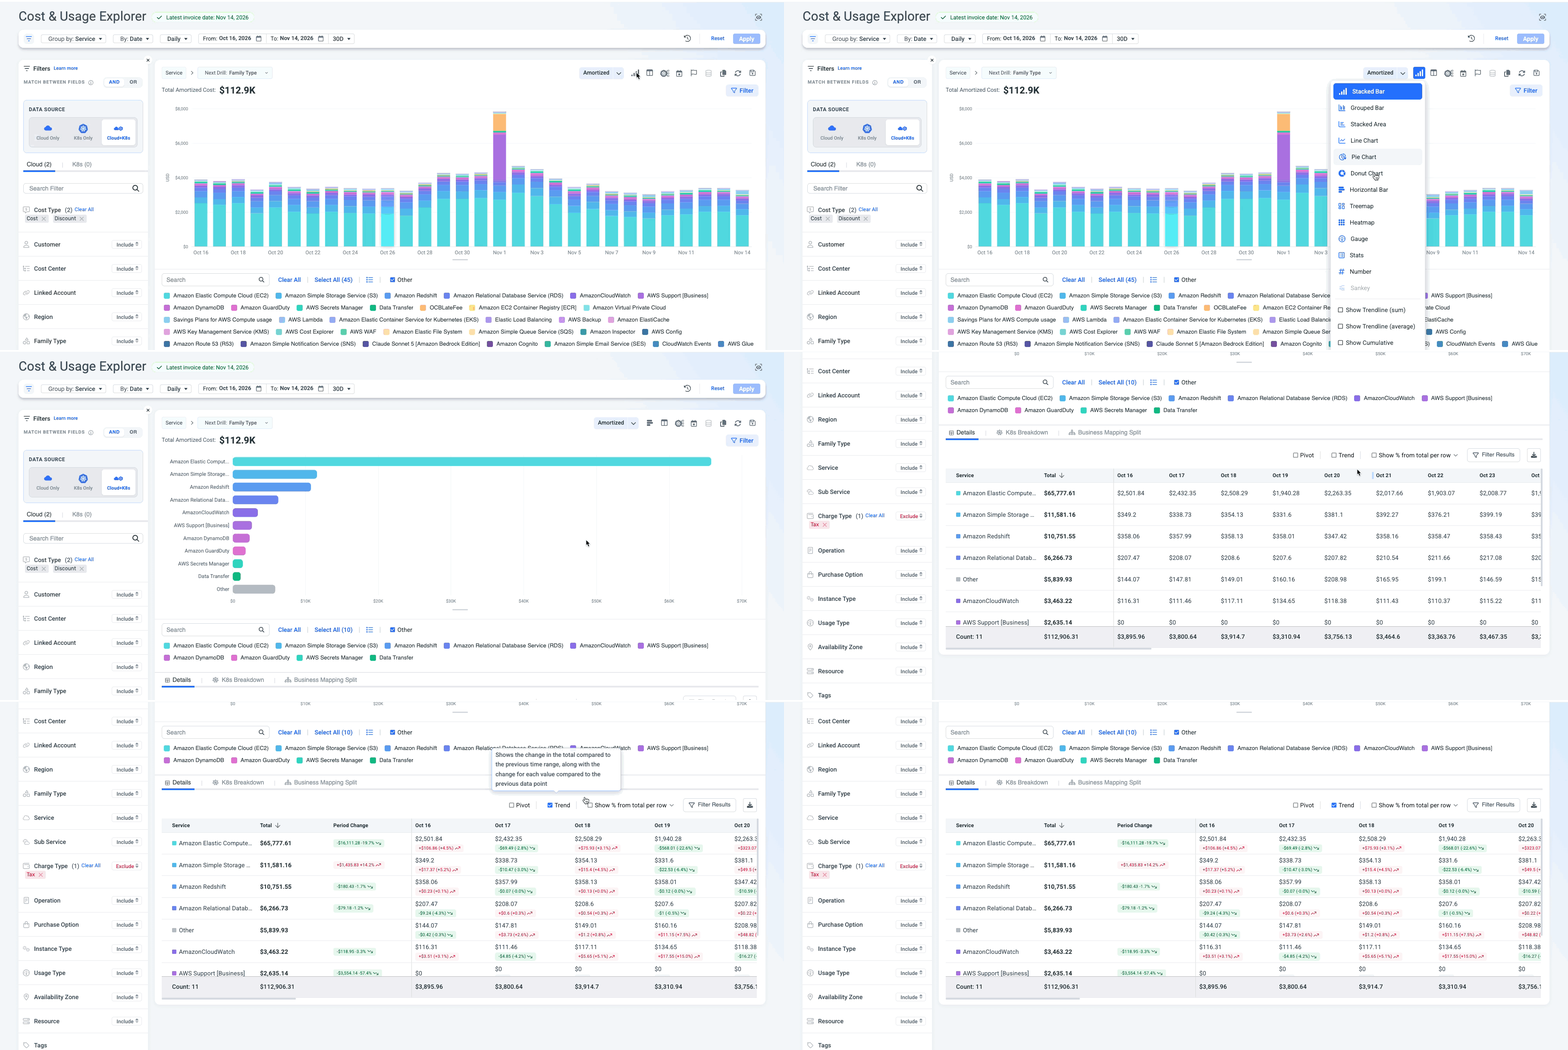
Table view, always on
A live table now sits under the chart, so the numbers are always right there. Sort and pivot it, see each value’s share of the total, and hover over any row to highlight it in the chart. For the full picture, turn on Trend to see exactly how each value changed compared with the previous data point.
Compare time ranges on one chart
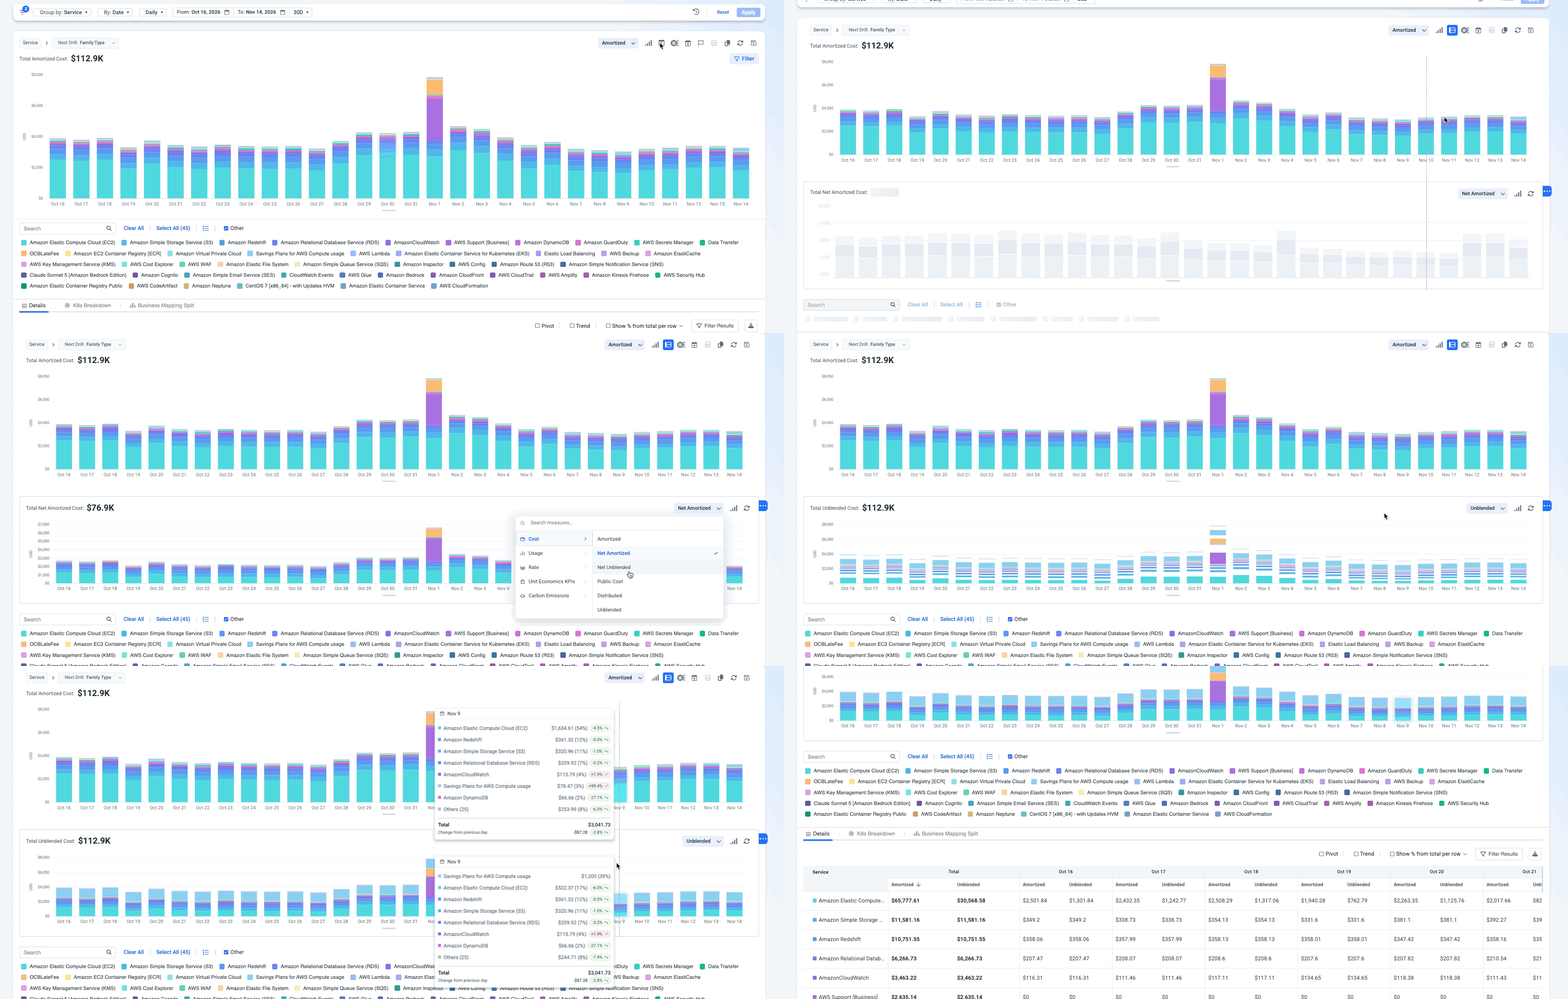
A new chart layout lets you compare the same filtered view across different time ranges on a single chart. For example, put the last 30 days side by side with the same period last year and spot what changed at a glance.
Compare Measurements
See several metrics at once, each in its own chart, stacked on a shared timeline. For example, view Unblended cost, Amortized cost, and Usage hours together and see how each one moves over time.
Multi Measure
Plot multiple measures on one chart, including cost, usage, rate, unit economics KPIs, custom metrics and carbon emissions. When cost spikes, you can tell right away whether usage or rate drove it.
New charts
Treemap, Horizontal Bar, Multi Bar, Gauge, Number, Heatmap, Stats, Pie and Sankey - plus refreshed Line, Table, Donut, Stacked Bar and Stacked Area. All dashboard-ready.
ALSO NEW
- Duplicate a view - Duplicate your view into an independent copy, tune each one separately, and save both to a dashboard.
- Filters history - Your searches from the last month are one click away, with all their filters restored. Pick up a previous analysis in seconds - whether it’s your own analysis or one from a user you can impersonate.
- Results filter - Focus on the values that matter by filtering results by cost or usage. Show only the top values, like the top 10 by cost, or set your own range.
- Date presets - Pick a time range in one click instead of choosing dates by hand. Presets run from Last Day to Previous 5 Years, including Month, Quarter and Year to date.
- Business Mapping split view - Open the new Business Mapping Split tab to see how shared cost flows between teams and products - as a Sankey or a table tracing each step’s cost.
- And there’s more - The new CUE is full of capabilities waiting to be discovered. Jump in, explore, and turn what you find into real insights for your team.
OpenAI Integration
Connect your OpenAI Platform organization to see your OpenAI API cost and usage alongside the rest of your spend. New dimensions break your spend down by factors like model, reasoning and agent, and per-user and per-project activity shows how your teams use OpenAI.
🔮 Coming soon: ChatGPT and Codex Enterprise.
GitHub Copilot Integration
Connect GitHub Copilot to AI Cost and see your Copilot seat and AI-credit costs in one place. Track how your developers use Copilot, from code suggestions accepted to lines written, by user, model, IDE and language. Find idle Copilot seats and reclaim them.
Azure and GCP Cloud AI
The AI Cost section now includes AI cost and usage from Azure and GCP , alongside AWS and your AI vendors. That means full visibility into AI spend across all major cloud providers and vendors, in one place. Services covered include Azure OpenAI, Gemini, Vertex AI and more.
Note: Available on the Enterprise plan.
MongoDB Atlas
Your MongoDB costs are now in Umbrella. Connect your Atlas organization in a few clicks to see MongoDB spend alongside your cloud costs, then track, analyze and report on it with the same tools you already use for the rest of your spend.
ClickHouse Cloud
ClickHouse joins your Umbrella cost view. Once connected, you can see what each ClickHouse service costs, split into compute, storage, backup and data transfer. Explore that spend with the existing Umbrella tools.
AWS CUR 2.0 Migration
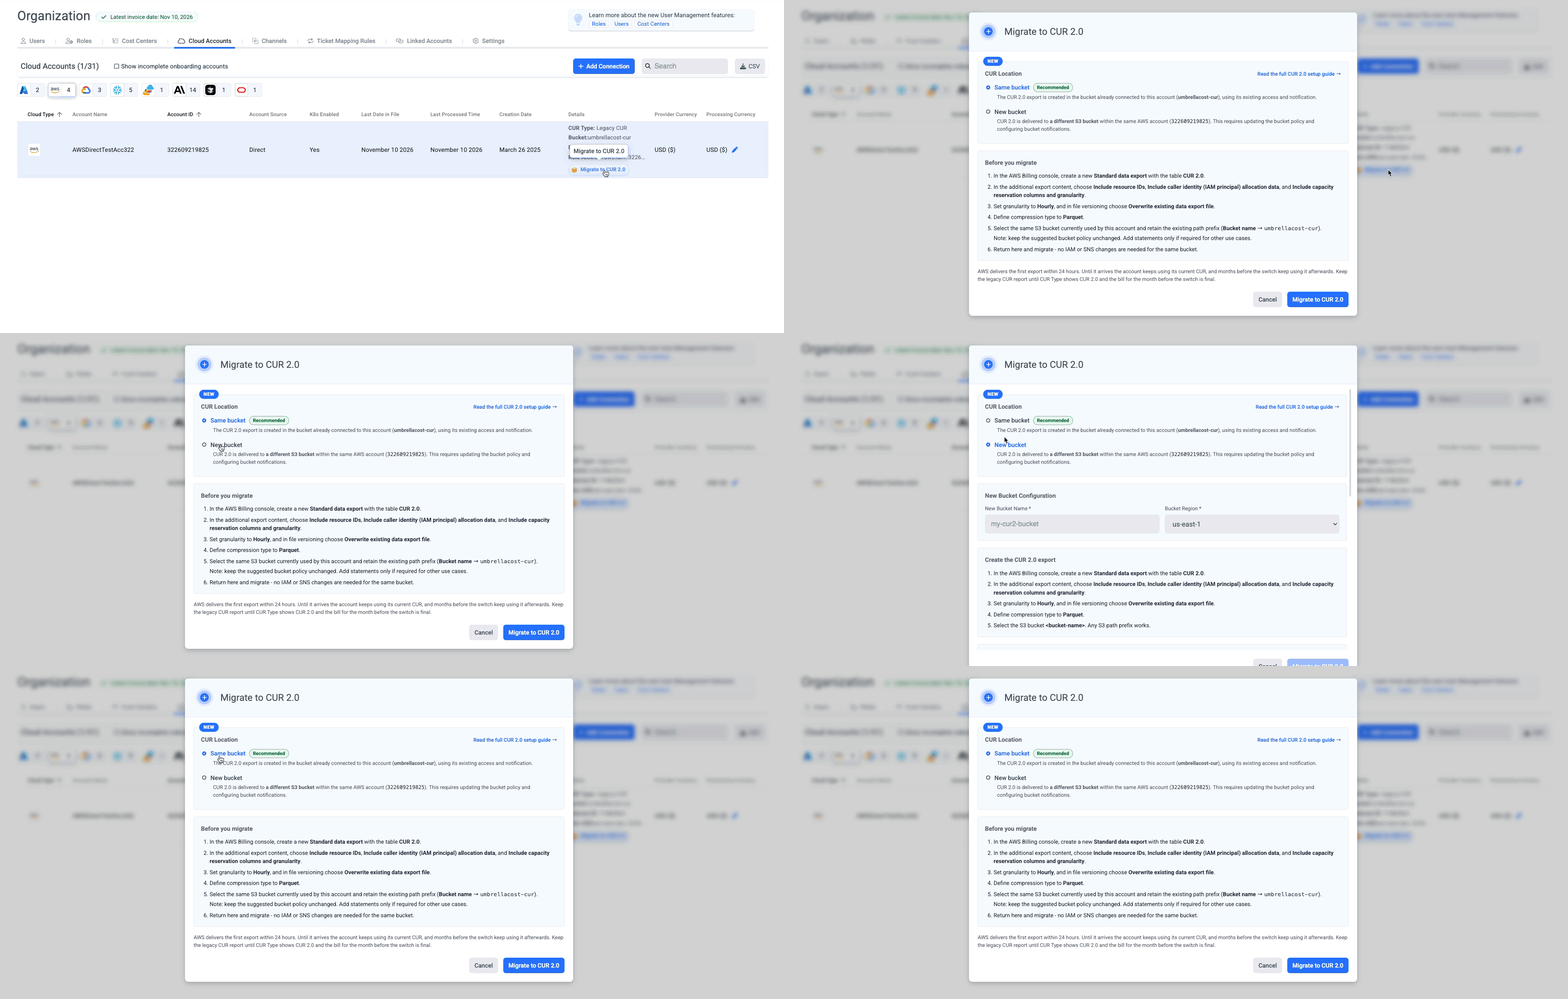
Move your AWS accounts to CUR 2.0 with a guided migration right inside Umbrella, with no lost history and no extra setup. CUR 2.0 adds richer detail to your AWS AI costs, such as IAM principal and application, so you can see exactly who and what is driving your AI spend.
Dashboard Snapshots
Large dashboards now open much faster. Umbrella saves a ready-made snapshot of the dashboard and keeps it up to date, so you see your data right away.
Note: To enable it for your account, contact the Umbrella support team.
New Azure Dimensions
Slice your Azure costs in new ways with four new dimensions: Publisher Name, Publisher Type, SKU ID (FOCUS exports only) and Commitment Discount Status. Use them across Umbrella, including the Cost & Usage Explorer, Assets, Billing Rules and more.
Umbrella MCP Server improvements
- More to ask about
AI Cost (“how much did we spend on AI last month?”, “Bedrock vs Anthropic”), Business Mapping logic (“how is the R&D Team mapping built?”, “which team grew most vs. last month?”), AWS commitments, budgets and Kubernetes costs. - Richer anomaly answers
Anomalies return with ID, comments, status history and daily data, so your assistant knows which are already handled. Ask about alerts and alert rules, or drill into a single anomaly. - Works with Cursor and ChatGPT
Umbrella MCP now integrates with Cursor and ChatGPT, so you can ask about your cloud and AI costs right from the tools your team already uses. - Connect through your own gateway
Prefer to route traffic through your own MCP gateway? You can connect to Umbrella MCP through it - just reach out to our support team at [email protected] to get your gateway added to our allowlist.