
Cost & Usage 2.0
Overview
The Cost & Usage Explorer is where you investigate your cloud spend. Filter and group your costs, see them as a chart and a table side by side. Advanced tools let you compare time periods, plot several measures together, and trace how shared costs are allocated across your business.
This page covers everything on the Explorer, from the basics to the advanced analysis tools. For step-by-step scenarios that combine these features, see the Cost & Usage Explorer use-case guide.
Page layout at a glance
| Area | What it does |
|---|---|
| Top bar | Filters, grouping, granularity, time range, and date presets |
| Chart | Visual trend of the selected measure(s), with a chart menu for options |
| Table | Exact values, totals, and changes for everything in the chart, K8s breakdown, and Business Mapping allocation breakdown. |
Build your view: the basics
Filters
Narrow the data to exactly what you need. Filters cover cloud, Kubernetes, and AI dimensions, such as service, tags, IAM principal, nodes, and more. For the full list, see Filter dimensions.
For each filter, you can:
- Include or exclude - show only the values you select, or show everything except them.
- Match exact or partial values - select specific values, or match every value that contains a piece of text. For example, show all linked accounts that contain "prod".
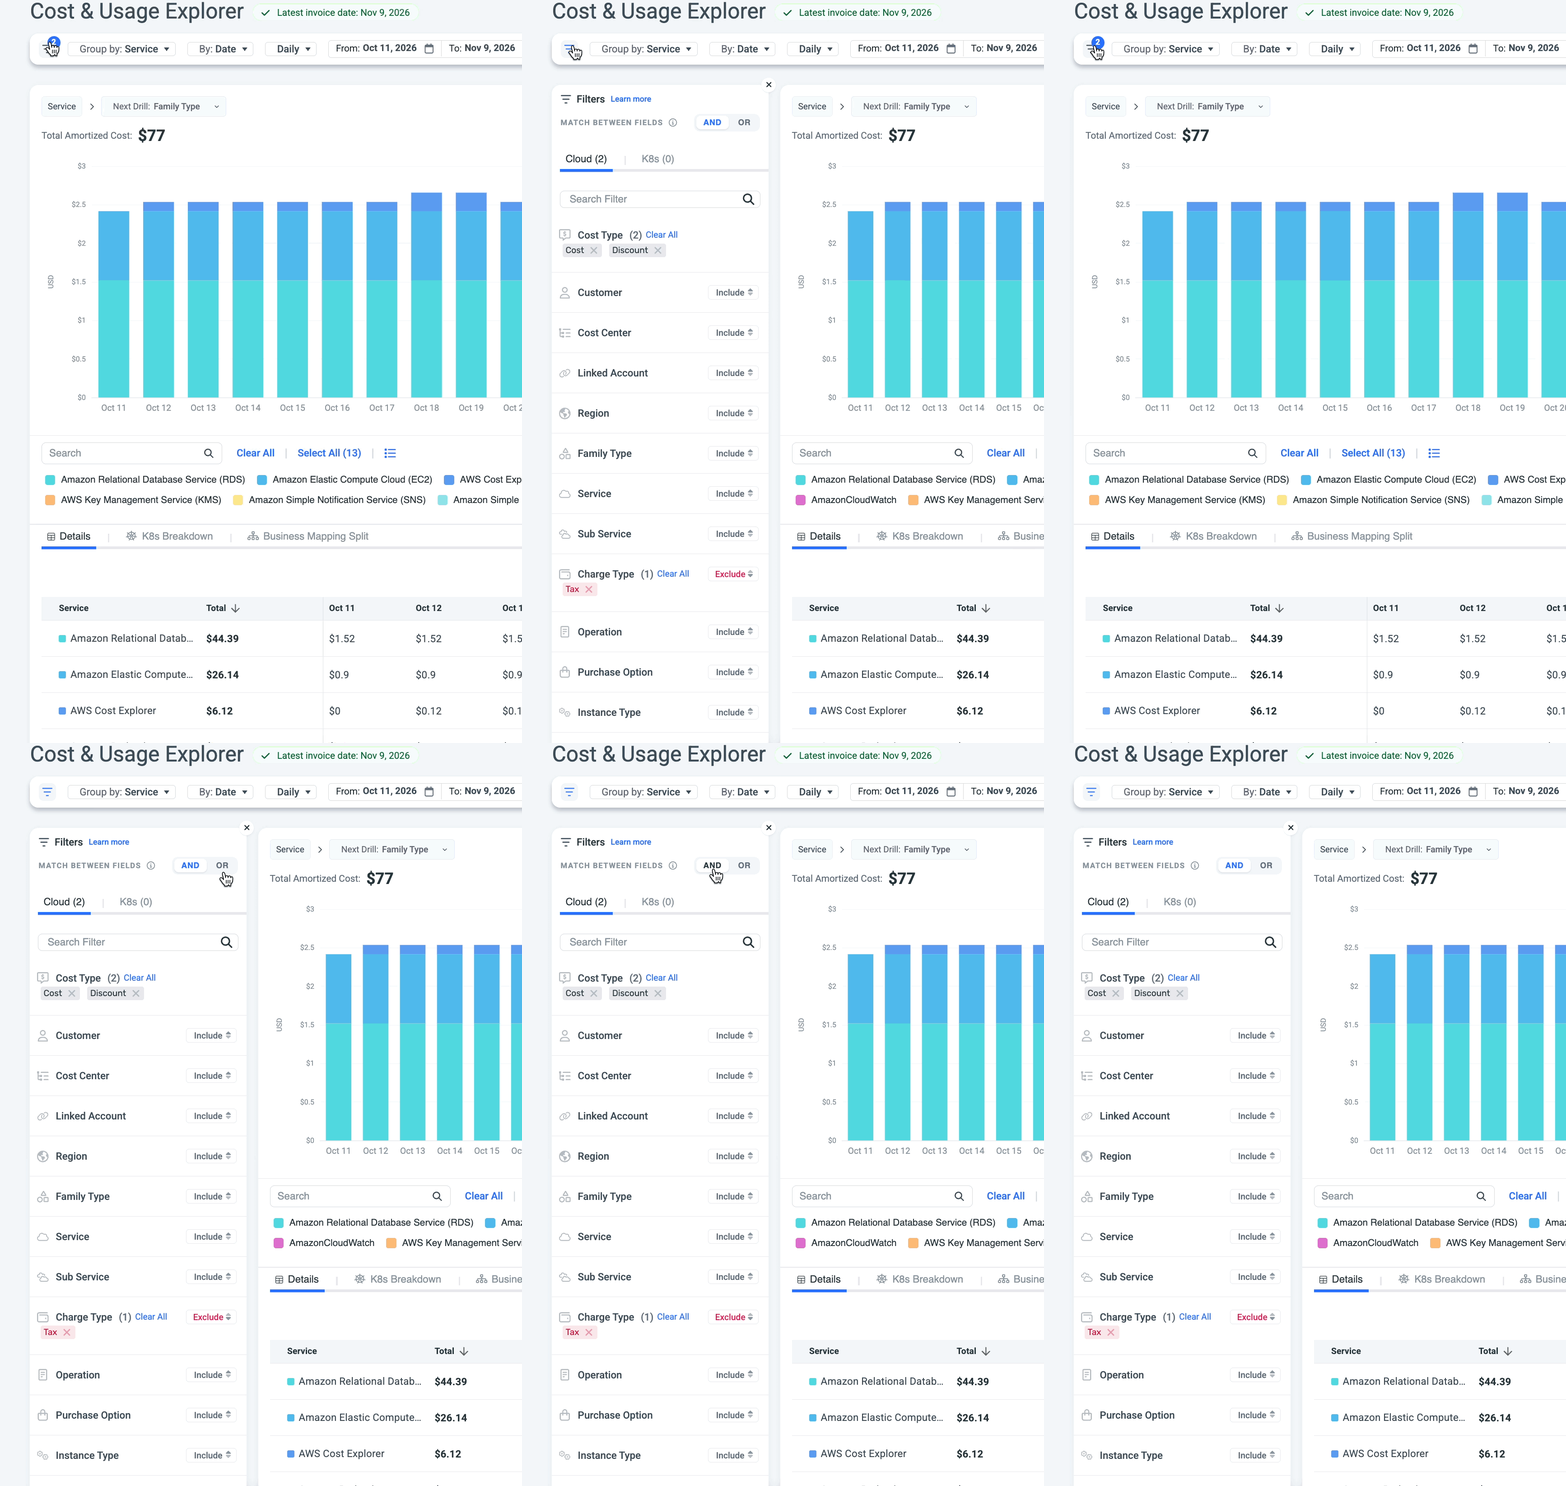
Combine filters with AND / OR. At the top of the filter panel, choose how your filters work together:
- OR - show data that matches any of the filters. For example, Node tag or Cloud tag.
- AND - show only data that matches all of the filters. For example, Service = EC2 and Region = us-east-1.
Group by
Split the chart and table by a dimension such as service, account, region, tag, or Business Mapping.
See the flow with a Sankey chartGroup by two dimensions and switch to a Sankey chart to see how costs flow between
Granularity
Choose how data points are bucketed over time: hourly, daily, weekly, monthly, quarterly, and yearly.
Time range and date presets
Pick a manual date range, or choose a date preset that rolls forward automatically.
You select either a manual range or a preset - not both.
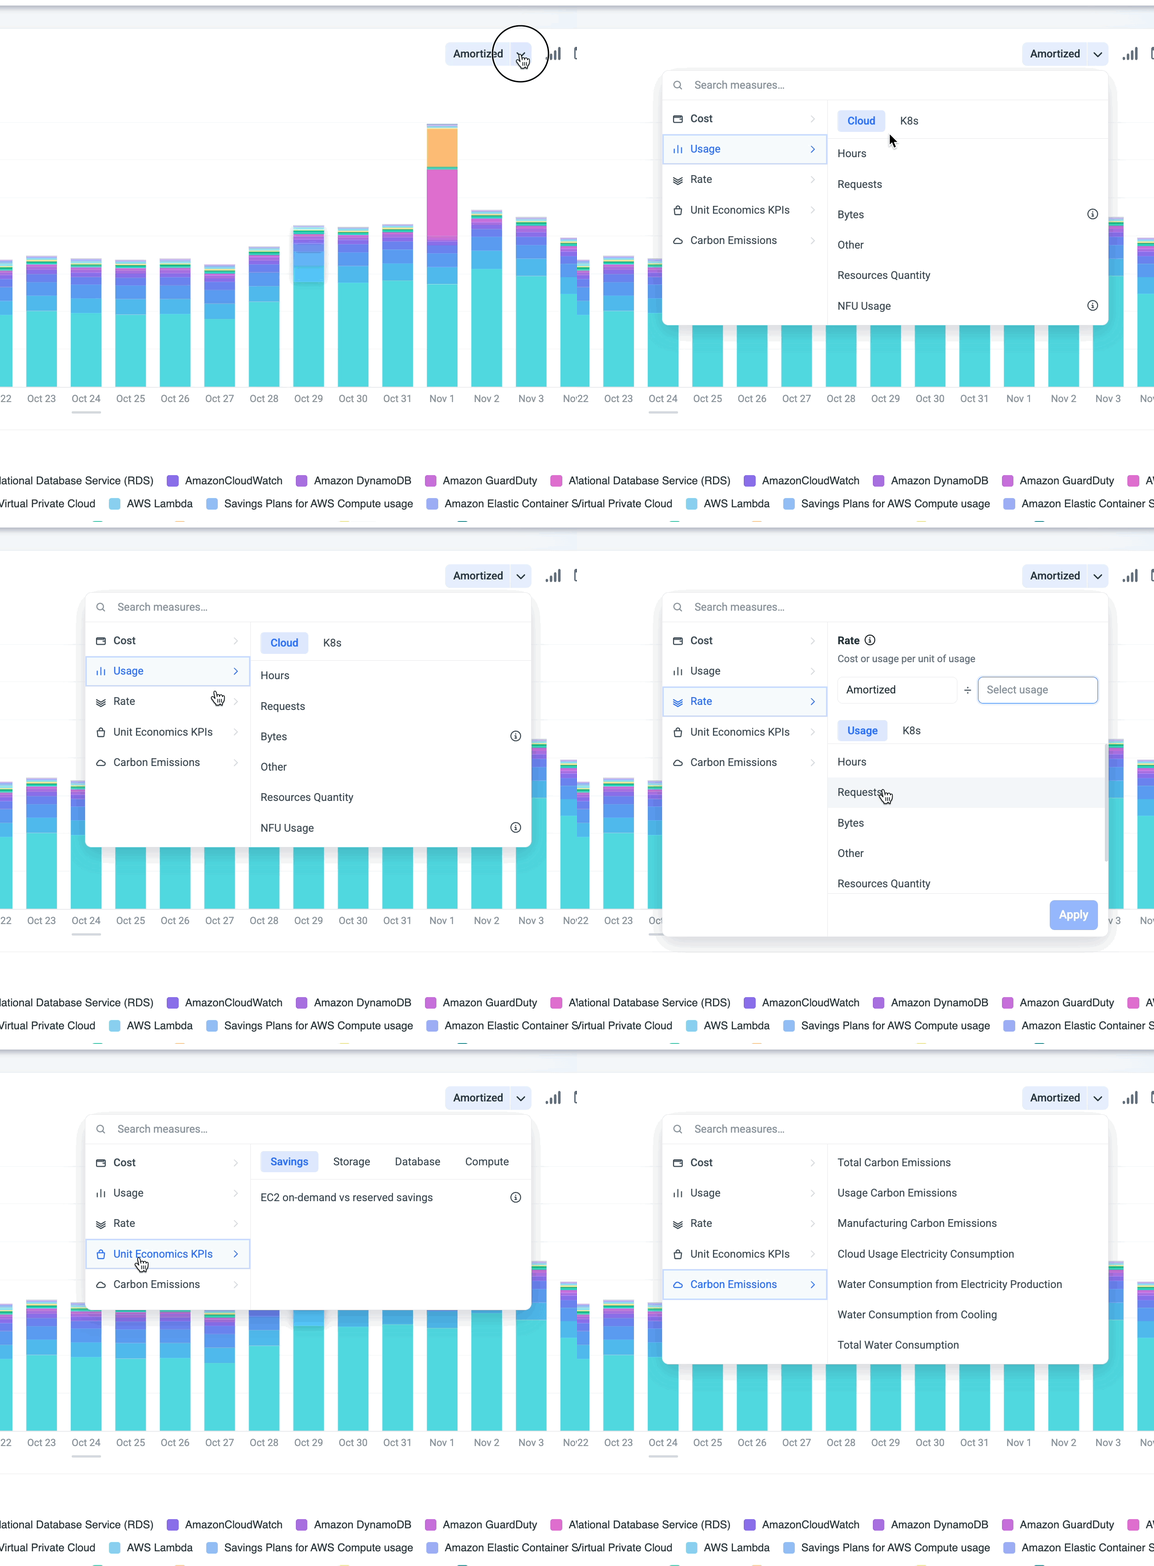
Cost type and measure
Choose what you are measuring - for example, amortized or unblended cost, usage, rate, a unit economics KPI, or carbon emissions. To show more than one measure at once, see Multi-measure.
Read the data
Chart menu
The chart menu gives you control over how the data is shown, what's layered on top of it, and how you save or share it.

-
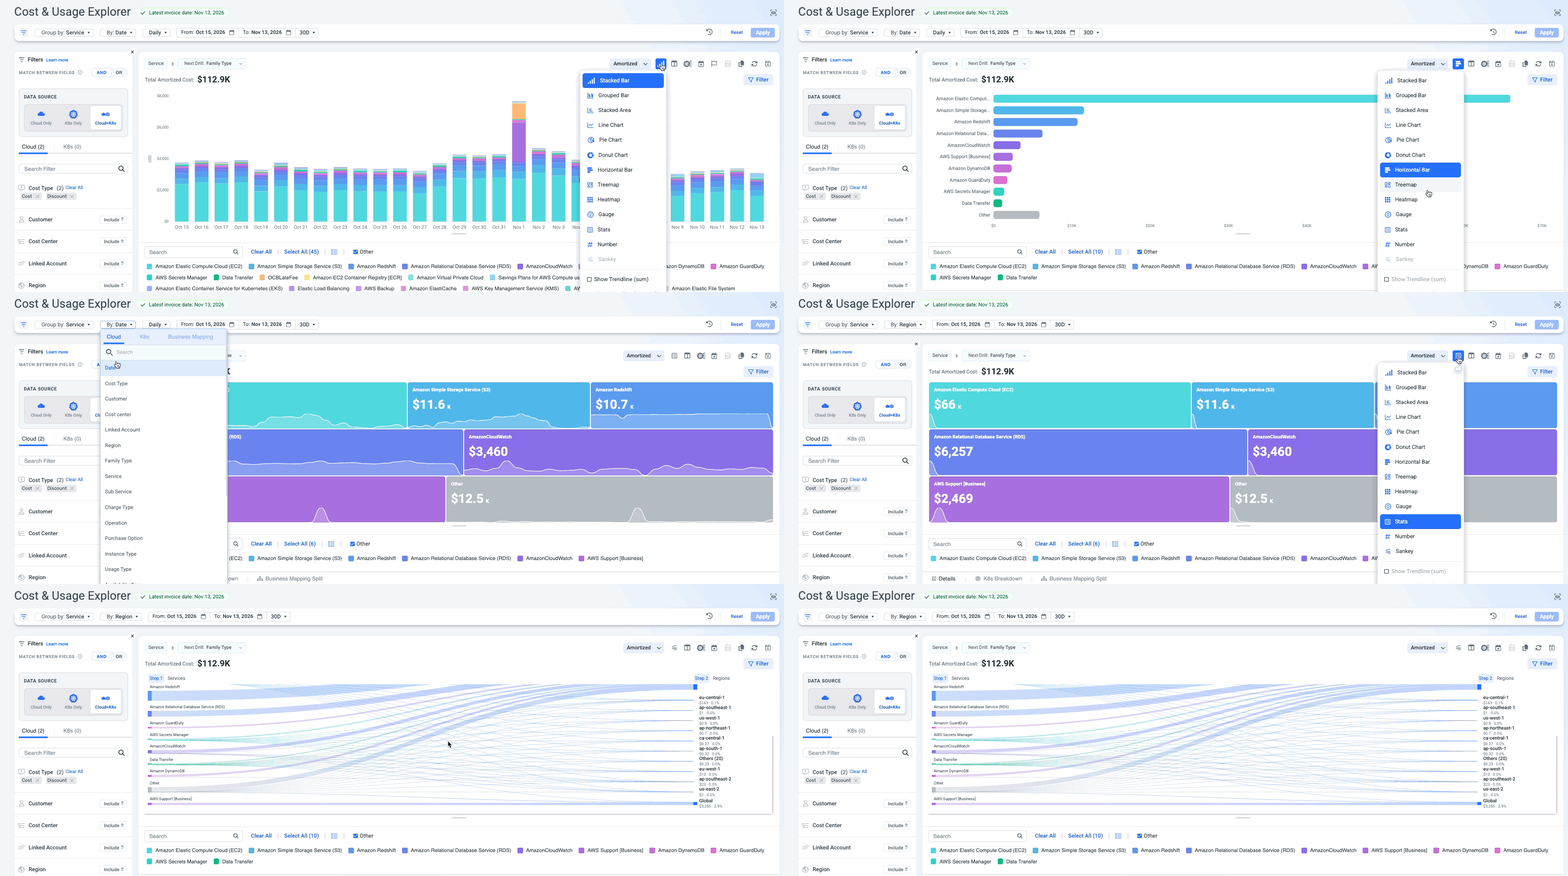
Chart type - Pick the chart that best answers your question:
Chart type Best for Line Following trends over time and comparing several measures, such as cost vs. usage Stacked area Seeing how each group adds up to the total over time Stacked bar Comparing totals per period while seeing what each group contributes Multi bar Comparing groups side by side within each period, such as each service month over month Horizontal bar Ranking groups by cost to find your top spenders, especially when names are long Pie Seeing each group's share of the total for the selected period Donut Same as Pie, with the total shown in the center Treemap Spotting the biggest cost drivers at a glance across many groups Heatmap Finding patterns and spikes by group over time, such as which services peak on which days Number Showing a single key figure, such as total cost for the period Gauge Showing progress of a value against a target Stats Showing a few key values side by side. You can set how many values to show Sankey Seeing how costs flow between two group-by dimensions, such as Service to Linked account.
Note: you must select two groupings in order to select this option.Turn on Trendline to add a trend line to the chart. Use it to see the overall direction of your costs beyond daily ups and downs, and to spot whether spend is growing faster than expected.
-
Chart layout - Choose how charts are arranged on the page. See Chart layout for details.
-
Allocate waste cost - For Kubernetes data only. Distribute unused node-level costs among the pods of each node, proportional to each pod’s actual usage.
-
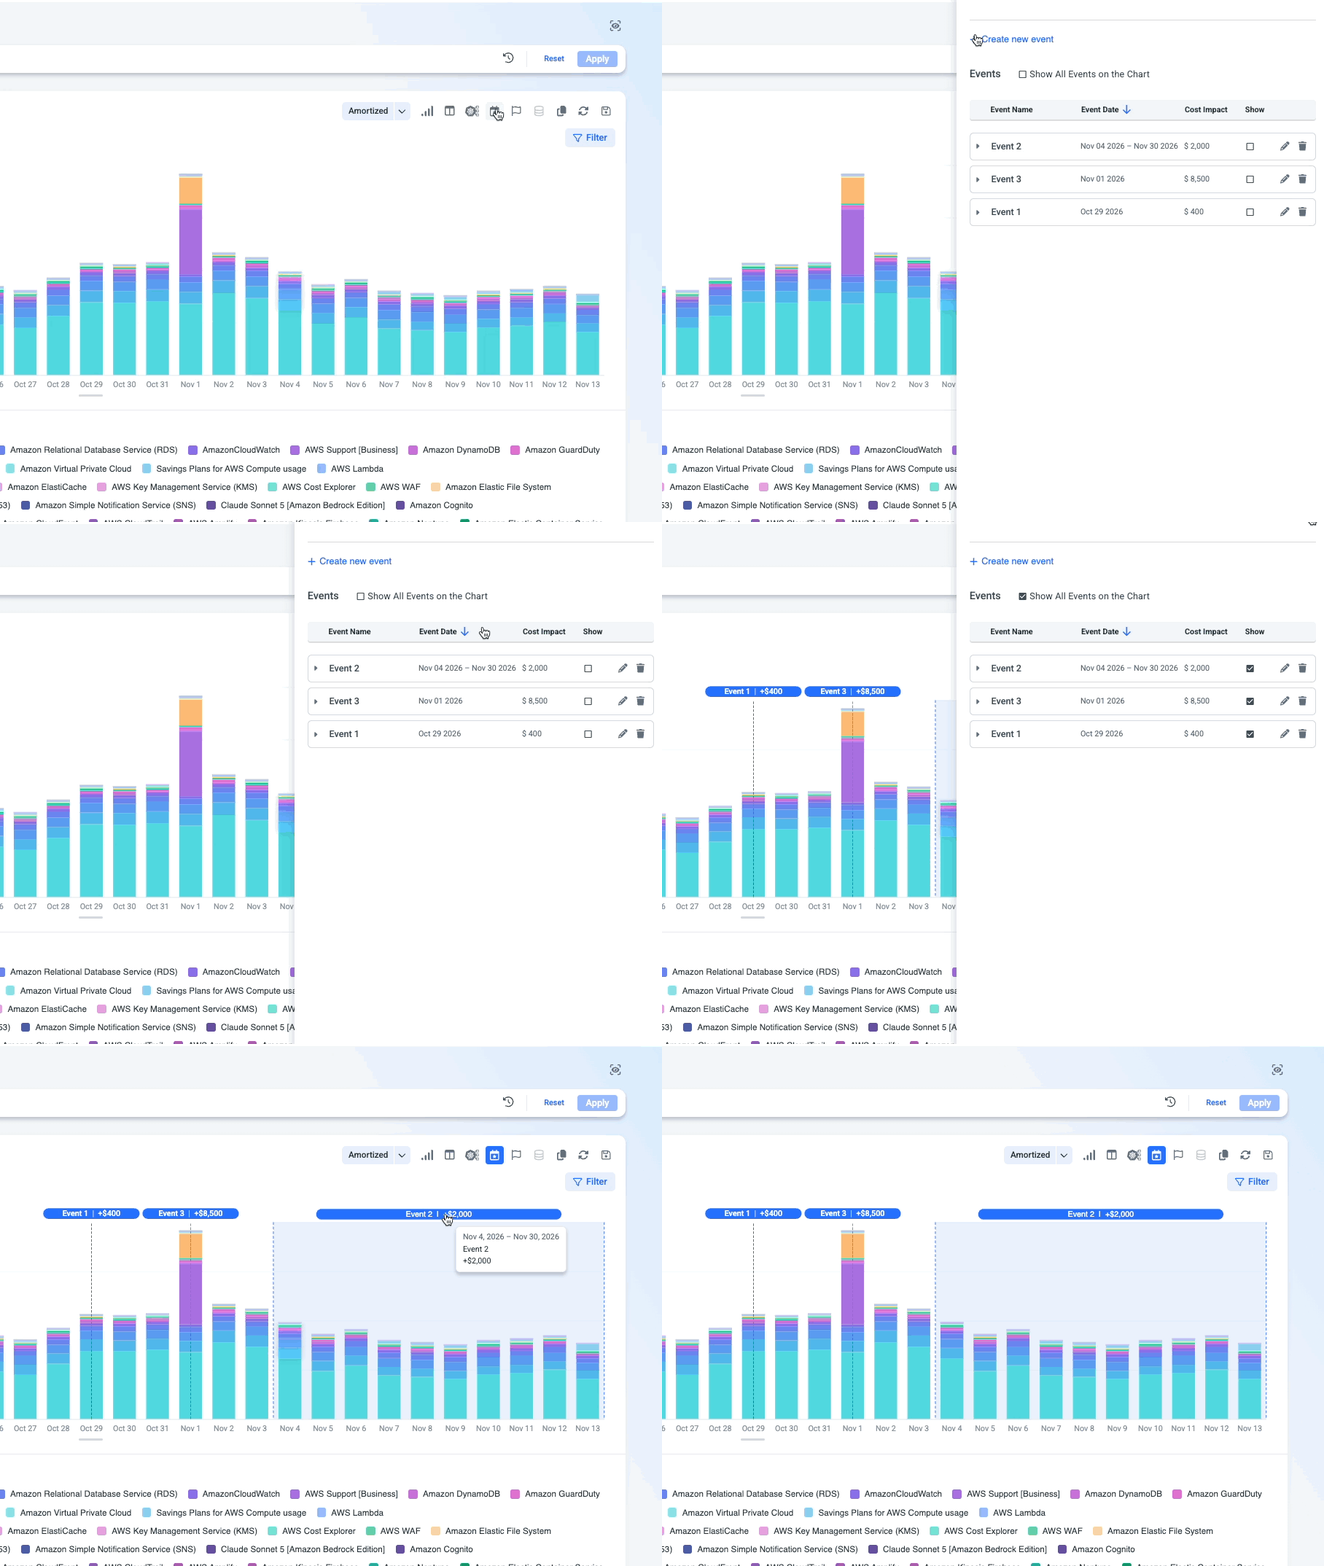
Events - Add events from your business, such as a deployment, a migration, or a new project, and see their cost impact on the chart timeline. Events are also saved to dashboards.
-
Goal - Learn more.
-
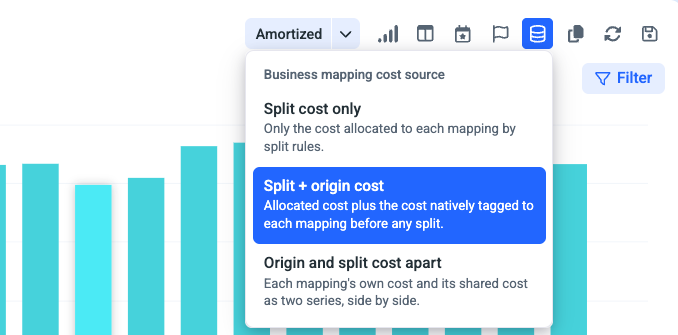
Business Mapping scope - Only available when you group by a Business Mapping that uses split rules. Choose which costs to show:
- Allocation cost only - only the costs allocated by the split rules.
- Allocation + origin cost - the allocated costs together with the original costs they came from.
-
Copy link - Copy a link to the exact view you're looking at, with all its filters and settings, to share with a teammate.
-
Reset - Clear all your changes and return to the default view.
-
Save and export - Save as a dashboard or a report, or export to PDF.
Note: You can choose to save the chart, the table, or both as a panel into a dashboard.
Table
Under the chart you'll find three tabs: the main Table, K8s breakdown, and Business Mapping Split.
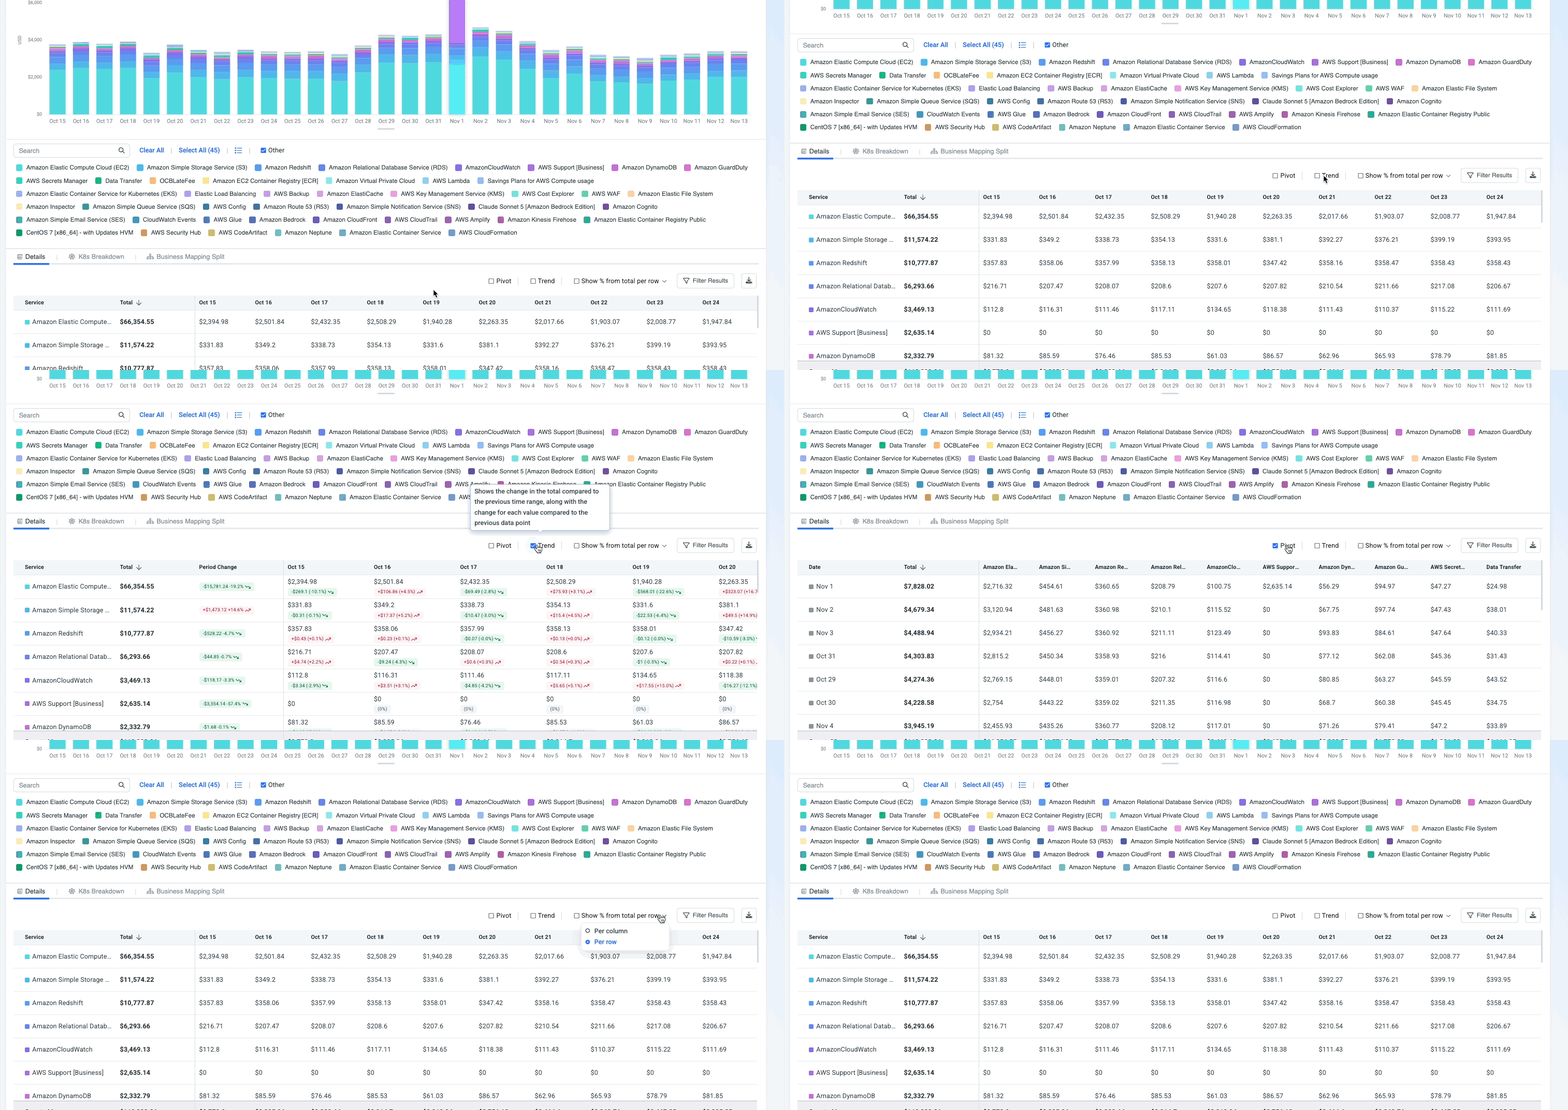
1. Details (table view)
The table sits under the chart and always matches what the chart shows. Hover over a row to highlight that value in the chart, or click the value in order to filter it and dive into the next dimension in the chart; row colors match the chart legend.
| Capability | What it gives you |
|---|---|
| Totals | Totals for rows and columns |
| Pivot | Swap rows and columns |
| Trend | Shows the change in $ and % from the previous data point. 💡 Click a change value to open Compare time ranges, where both periods are plotted on top of each other so you can investigate the change. |
| % of total | Each value as a share of its row or column total |
| Sort and filter | Reorder or narrow the rows |
| Download as CSV | Export exactly what you see |
2. K8s breakdown
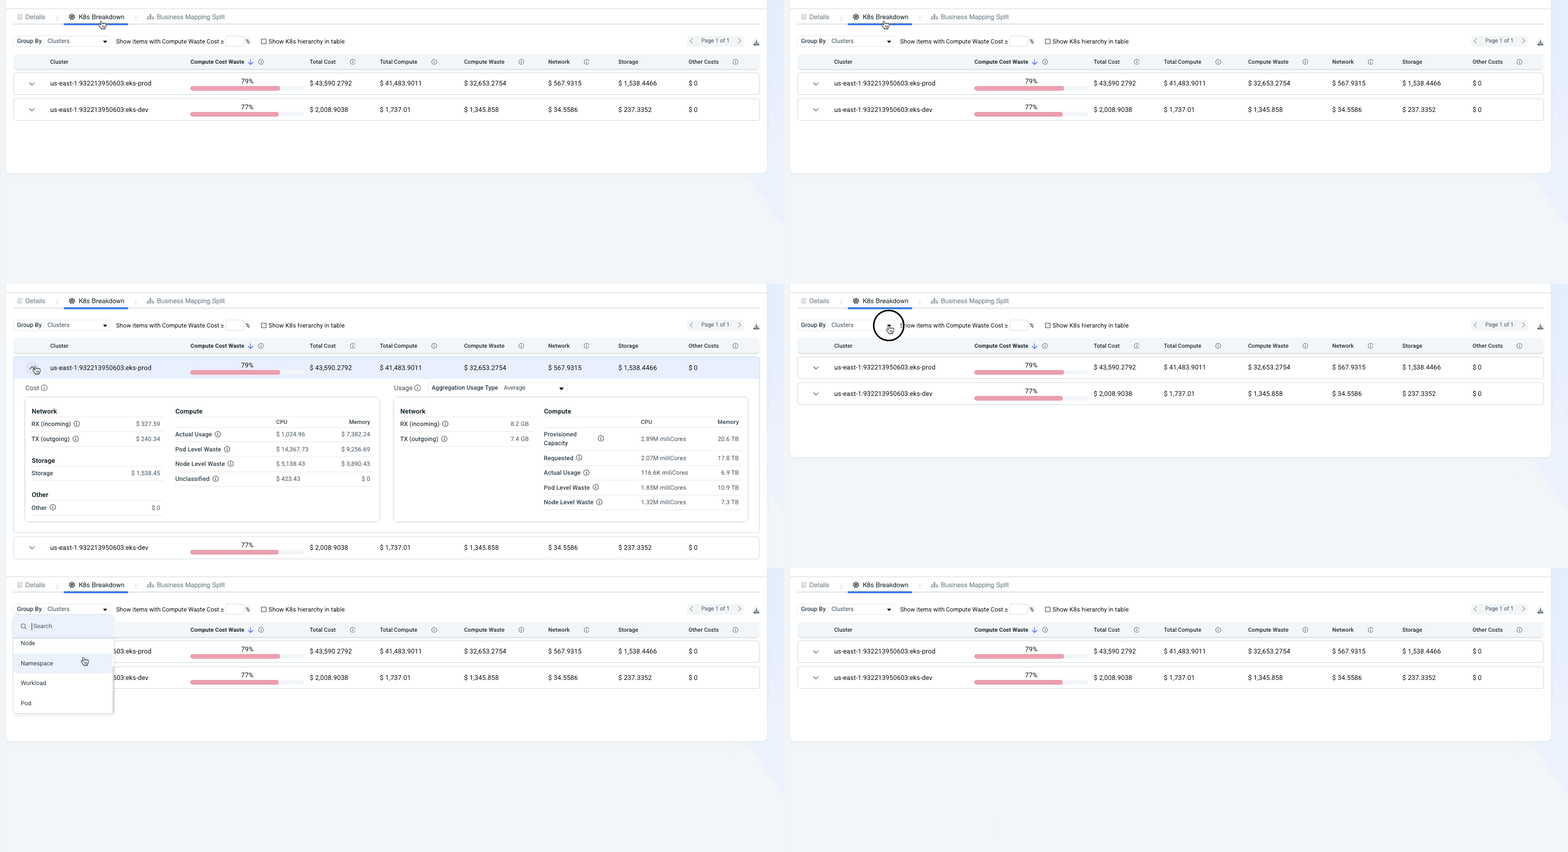
or Kubernetes data. Shows where your Kubernetes spend goes and how much of it is waste.
Set up the view
- Group by - choose the Kubernetes level to break costs down by, from cluster to pod.
- Show items with Compute Waste Cost ≥ X% - enter a minimum waste percentage to show only items above it. Use it to focus on the biggest waste.
- Show K8s hierarchy in table - show the Kubernetes hierarchy in the table.
Read the table
Each row shows the item's Compute Cost Waste (as a % with a bar), Total Cost, Total Compute, Compute Waste, Network, Storage, and Other Costs. Sort by any column, for example by Compute Cost Waste to put the most wasteful items on top.
Expand a row to see the full breakdown, split by CPU and Memory:
| Panel | What it shows |
|---|---|
| Cost | Cost of Network (RX incoming, TX outgoing), Storage, Other, and Compute: Actual Usage, Pod Level Waste, Node Level Waste, and Unclassified |
| Usage | Network traffic (RX, TX) and Compute: Provisioned Capacity, Requested, Actual Usage, Pod Level Waste, and Node Level Waste. Use Aggregation Usage Type (for example, Average) to choose how usage is aggregated. |
3. Business Mapping Split
Note: This tab is available when you group by a Business Mapping that uses split rules.
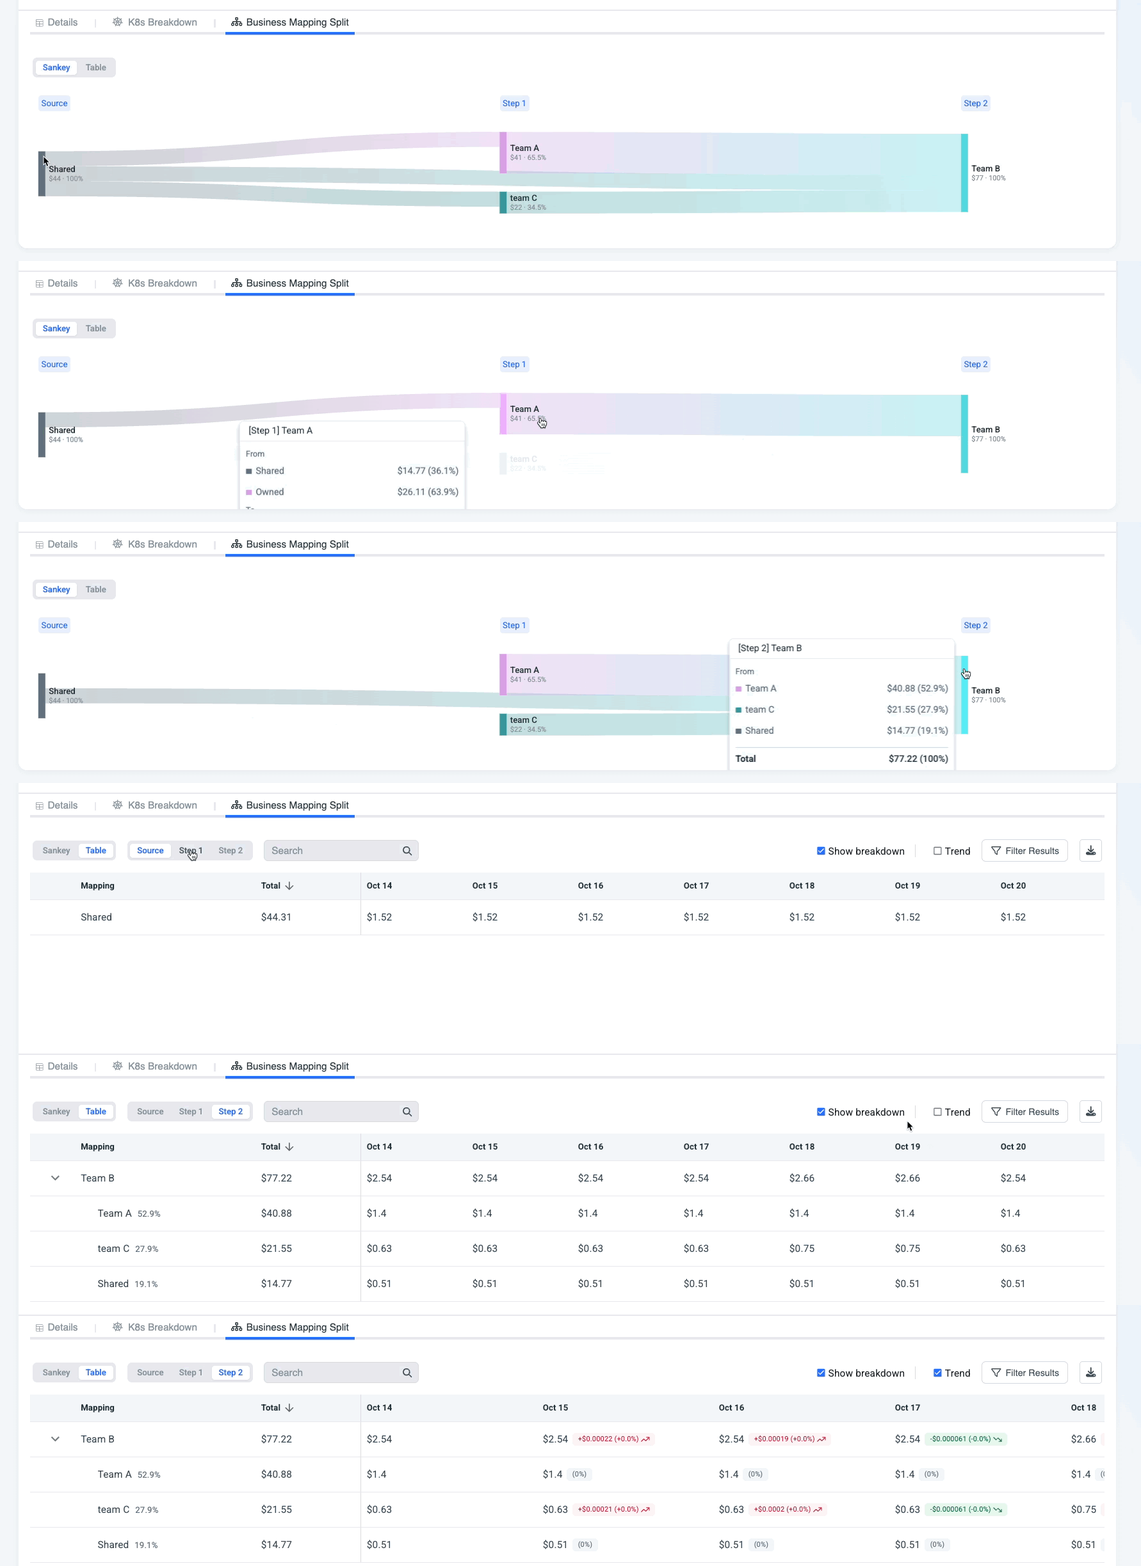
This view shows how shared costs were allocated, in two views:
-
Sankey - the allocation flow, from the original cost through each split step to the business unit that owns it.
-
Table - each allocation step with its breakdown. For example, Team B's $100 = $50 from Product A + $50 from Product B. You can hide the breakdown per step, see the change in $ and %, and download as CSV.
Choose the cost sourceYou can choose which costs each business unit shows: only the costs allocated to it, or the allocated costs plus the unit's own costs. For example, a team may receive shared costs from another unit while also having costs of its own.
To switch, open Business mapping cost source in the chart menu.
Filter results
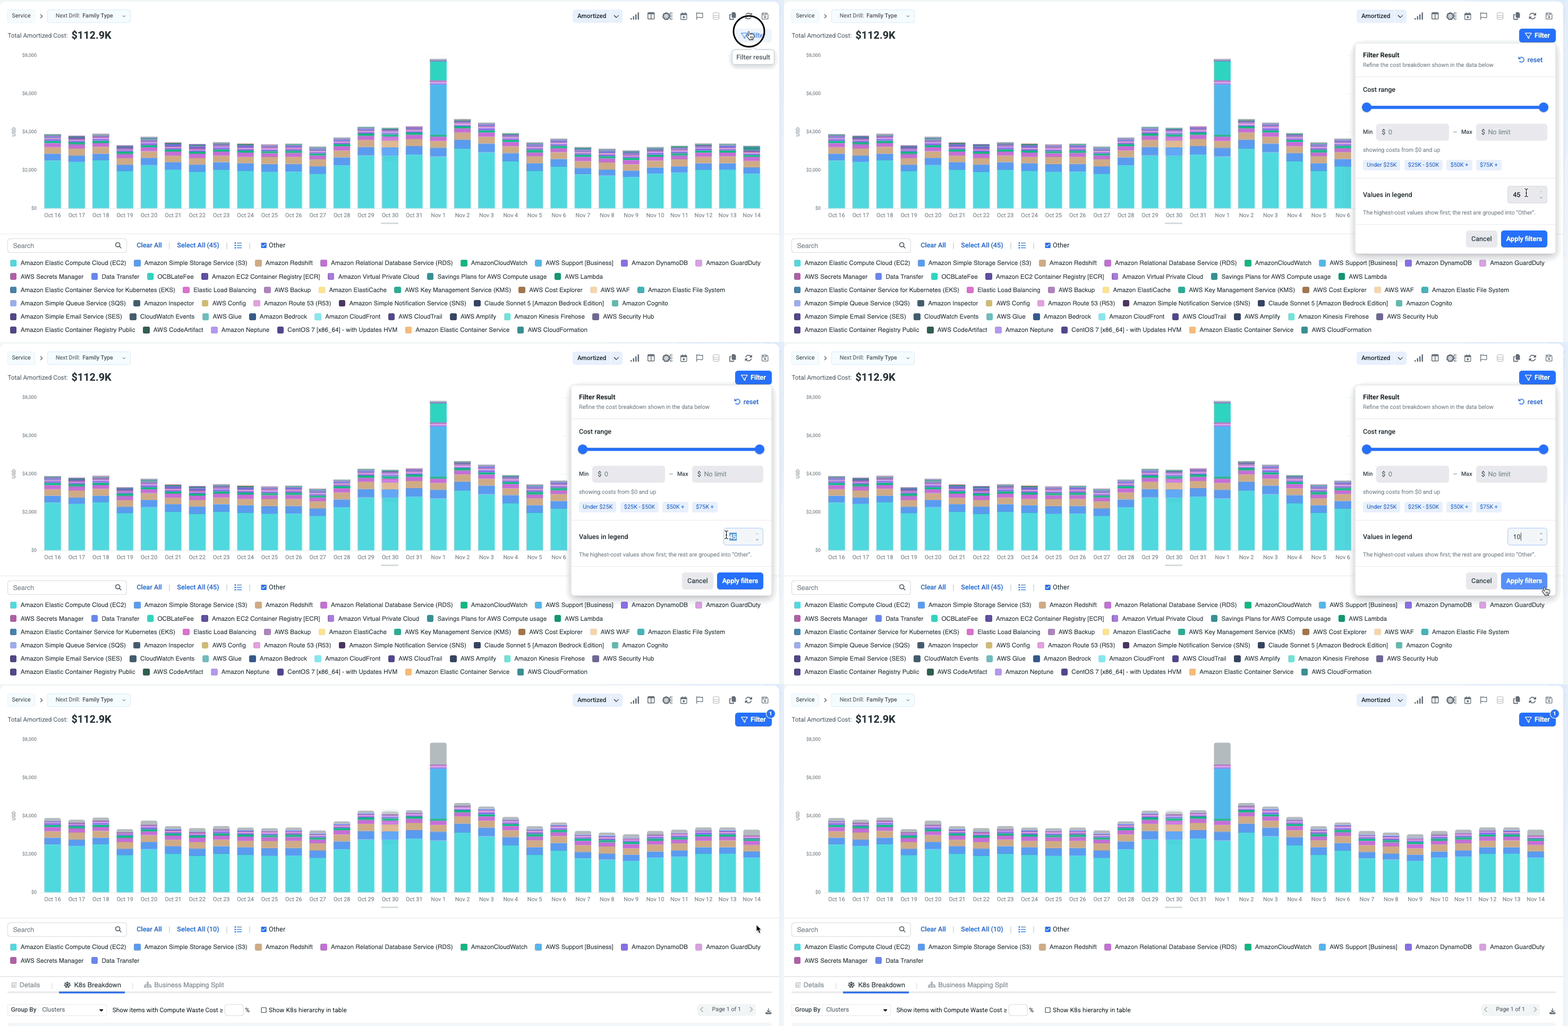
Clean up a noisy chart without changing your filters. Filter results applies to both the chart and the table.
- By cost range - set a minimum and maximum with a slider (from $0 up to your total), or pick a preset range.
- Top values - show only the top X values by cost or usage, up to 30.
Work faster 🚀
Search history
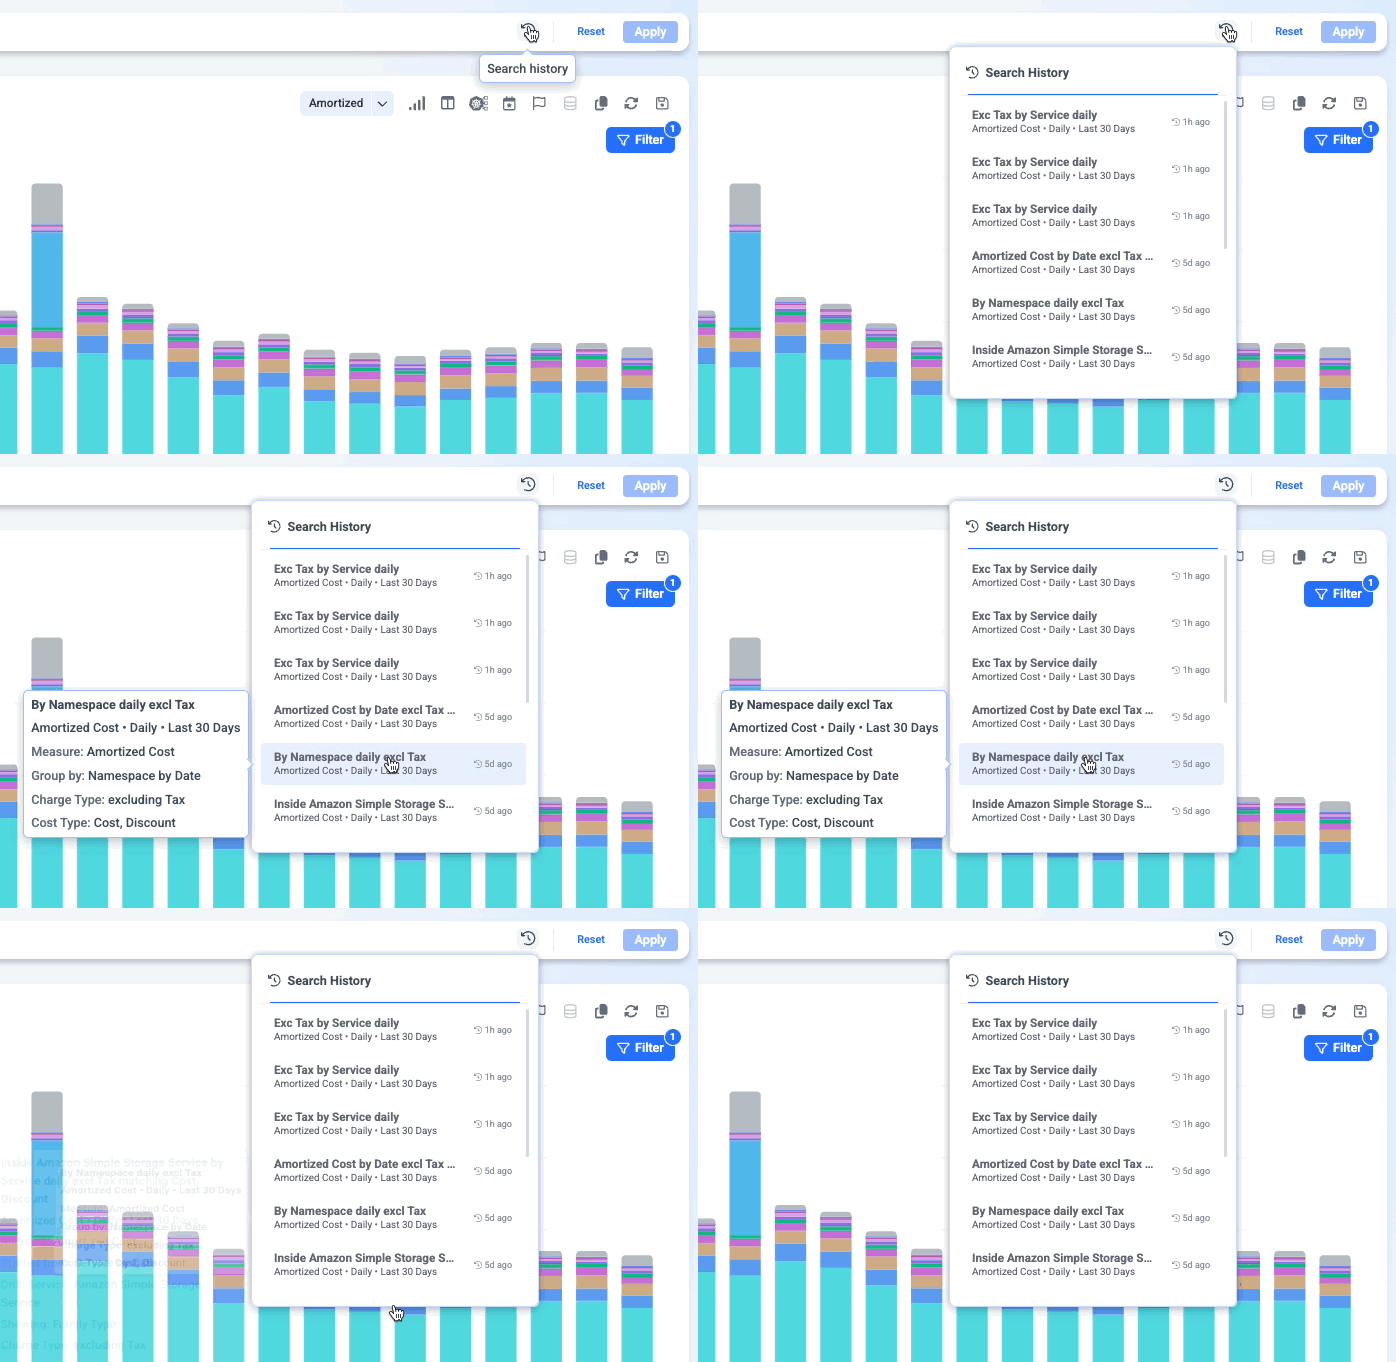
Reopen any search you ran in the past month. Click a search to restore the view with all its filters applied. Note: You can see your own history, and impersonate other users.
Views
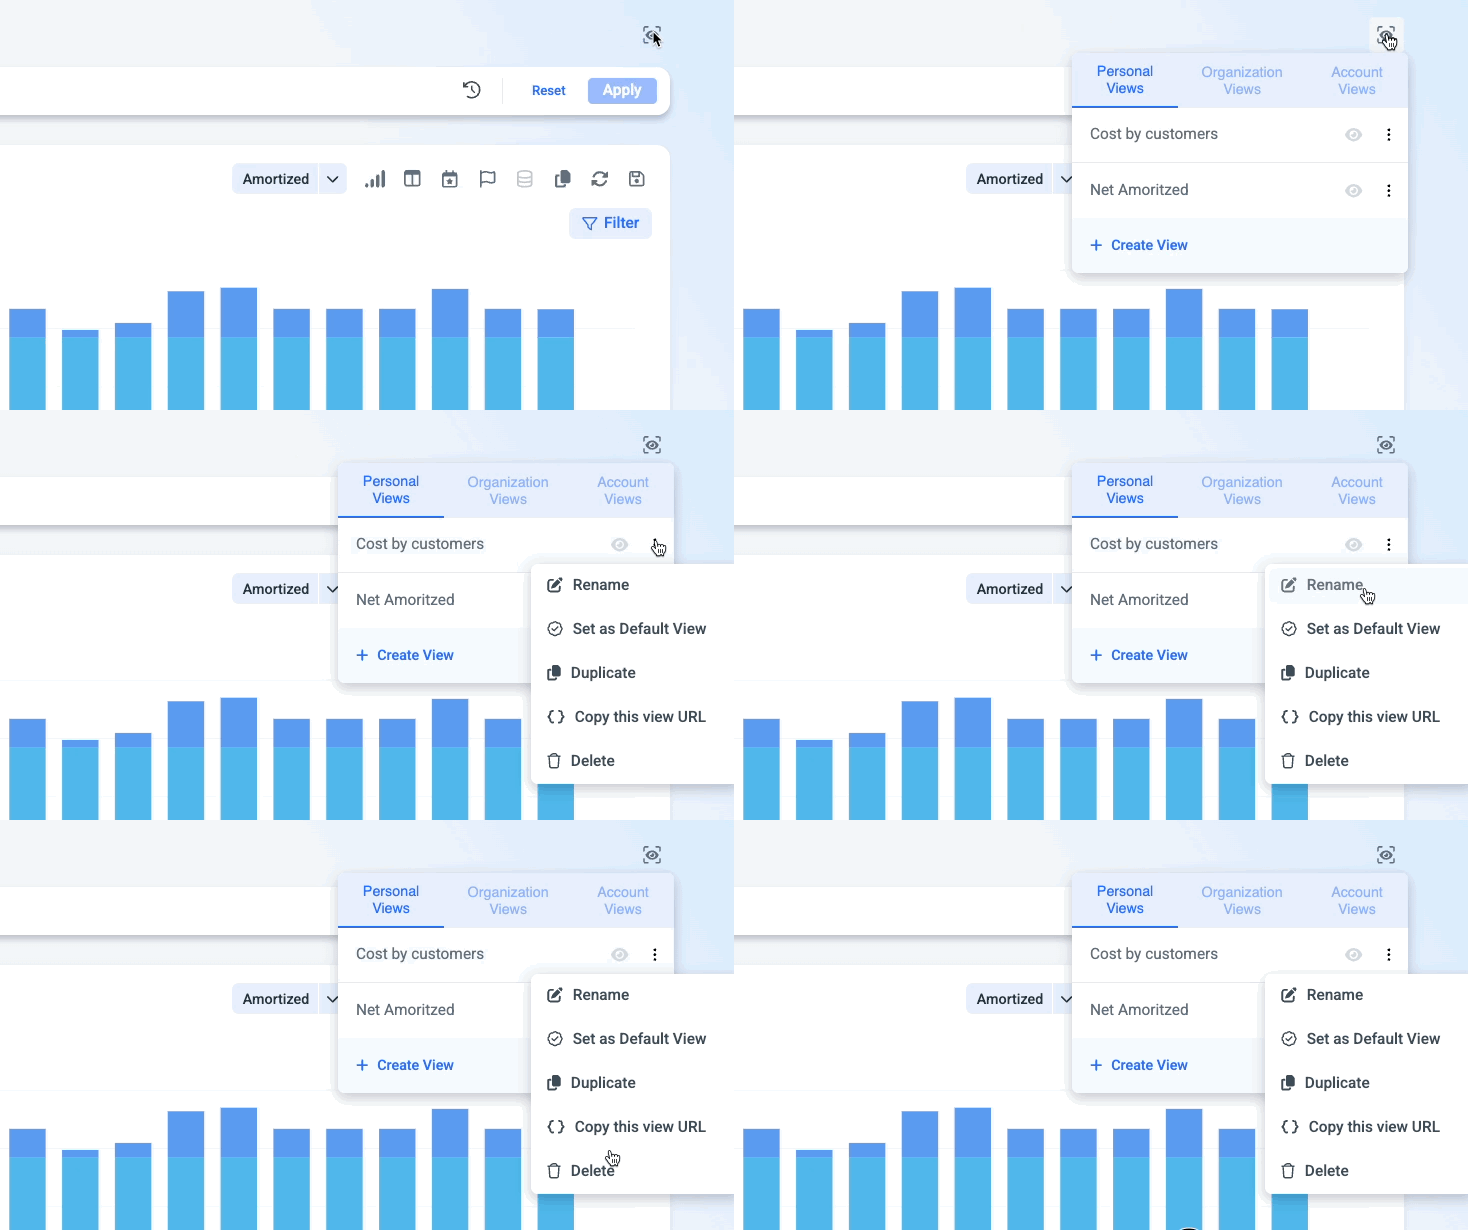
Save your current setup - granularity, date preset, grouping, filters (include and exclude), cost, usage, rate, graph options, and view options - as a view, and choose one as your default.
| View type | Who sees it |
|---|---|
| Personal | Only you |
| Account | Everyone on the account it was created in |
| Organization | All accounts of the same cloud provider in your organization |
MSPs and resellersViews and defaults a reseller creates at the organization or account level are also visible to that reseller's customers. When a customer sets their own default, it overrides the reseller's default for that customer.
Save as dashboard
Save the chart, the table, or both to a dashboard. All CUE 2.0 chart types, saved views, and date presets carry over to the dashboard.
Advanced analysis
Go beyond a single chart to compare periods, combine measures, and break down shared costs. Use these 4 different views for in-depth analysis and to understand how your cost and usage behave over time.
1. Duplicate view
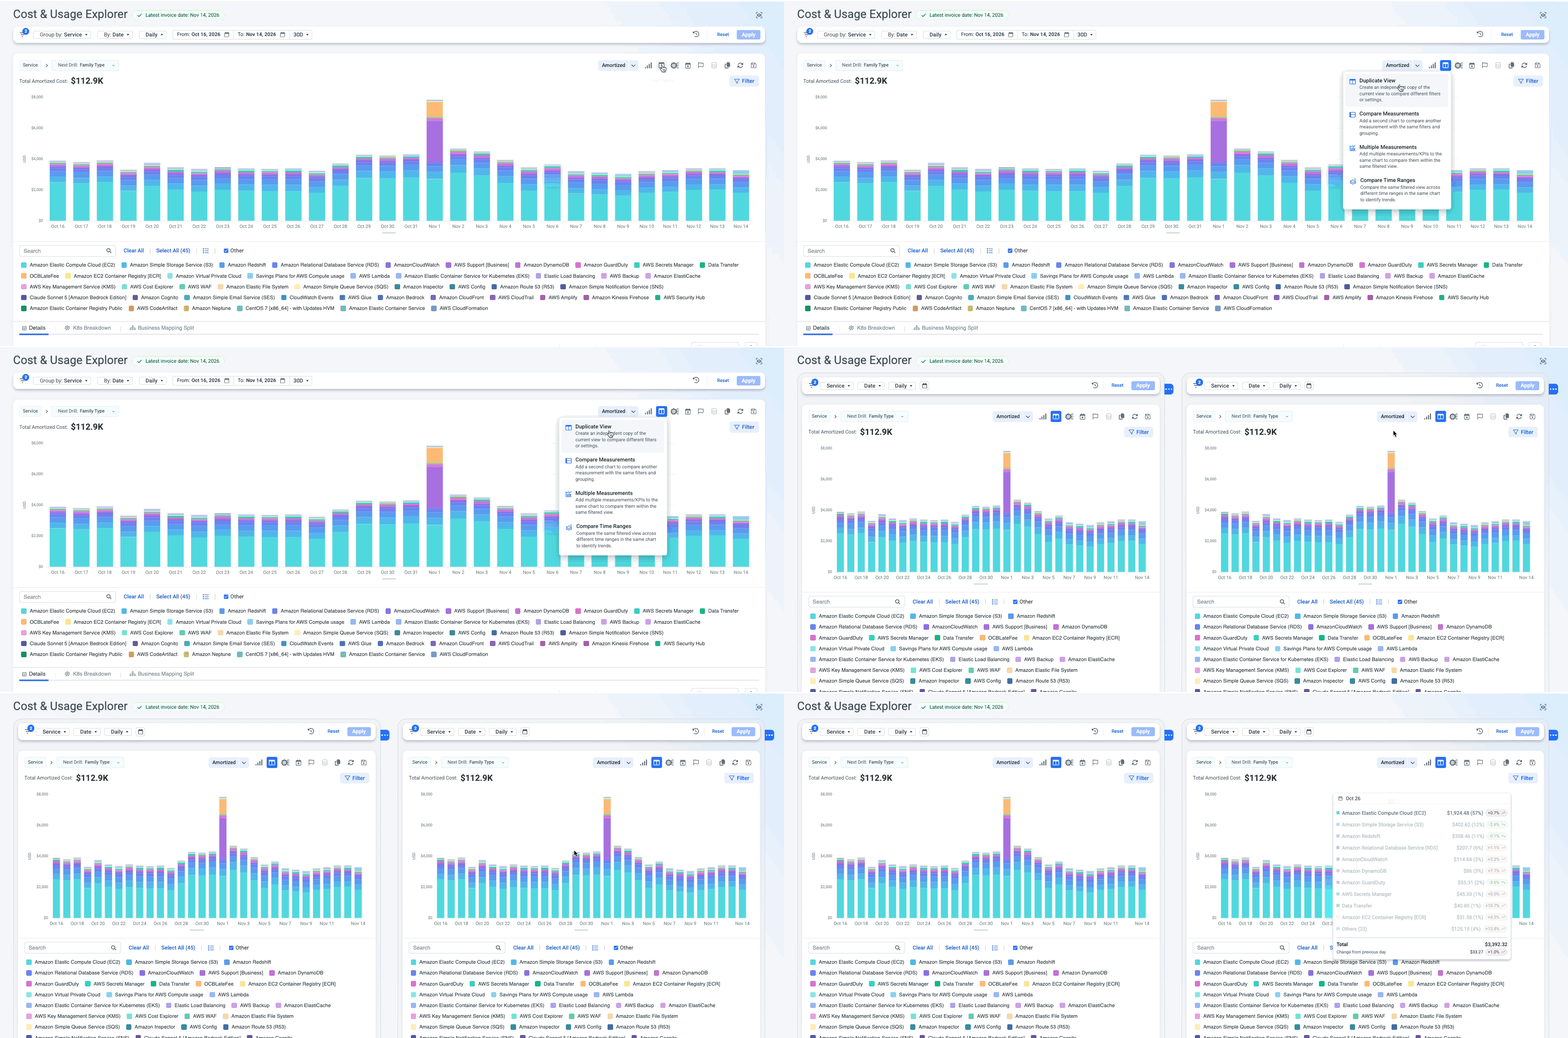
Create an independent copy of your current view, then change filters or settings in each one separately - for example, Production on the left and Development on the right. Each copy is saved to a dashboard separately.
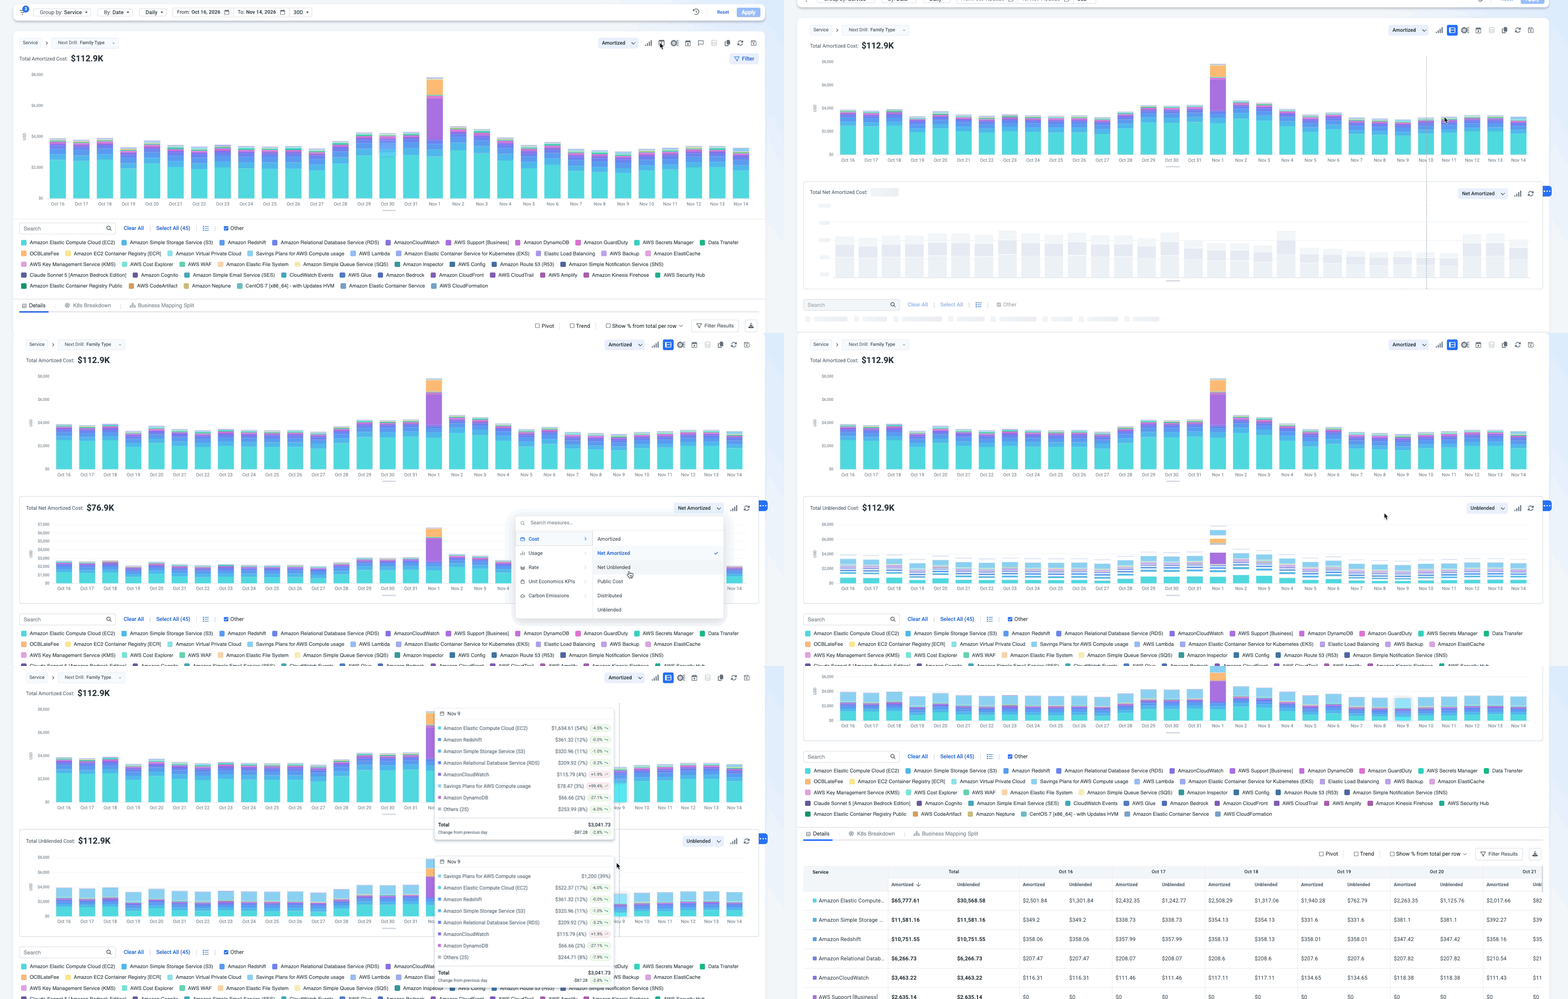
2. Compare Measurements (Multi chart view)
Add charts below the main chart, one per measure, all using the same filters and grouping. Use it when measures need their own scale or are easier to read separately - for example, Unblended Cost on top and Usage Hours below.
- Add multiple charts by clicking the 3-dot blue chip next to the chart.
- Drill-downs on the main chart apply to every chart.
- The table adds a column for each measure, side by side.
- Each added chart shows its own total and has a short menu: Chart Type, Events & Anomalies, and K8s Allocation.
- Saved to a dashboard, the charts appear stacked vertically.
Multi-measure or Multi chart?Multi-measure puts several measures on one chart - best for spotting correlation. Multi chart gives each measure its own chart - best when scales differ or each measure should stand alone.
3. Multi-measure
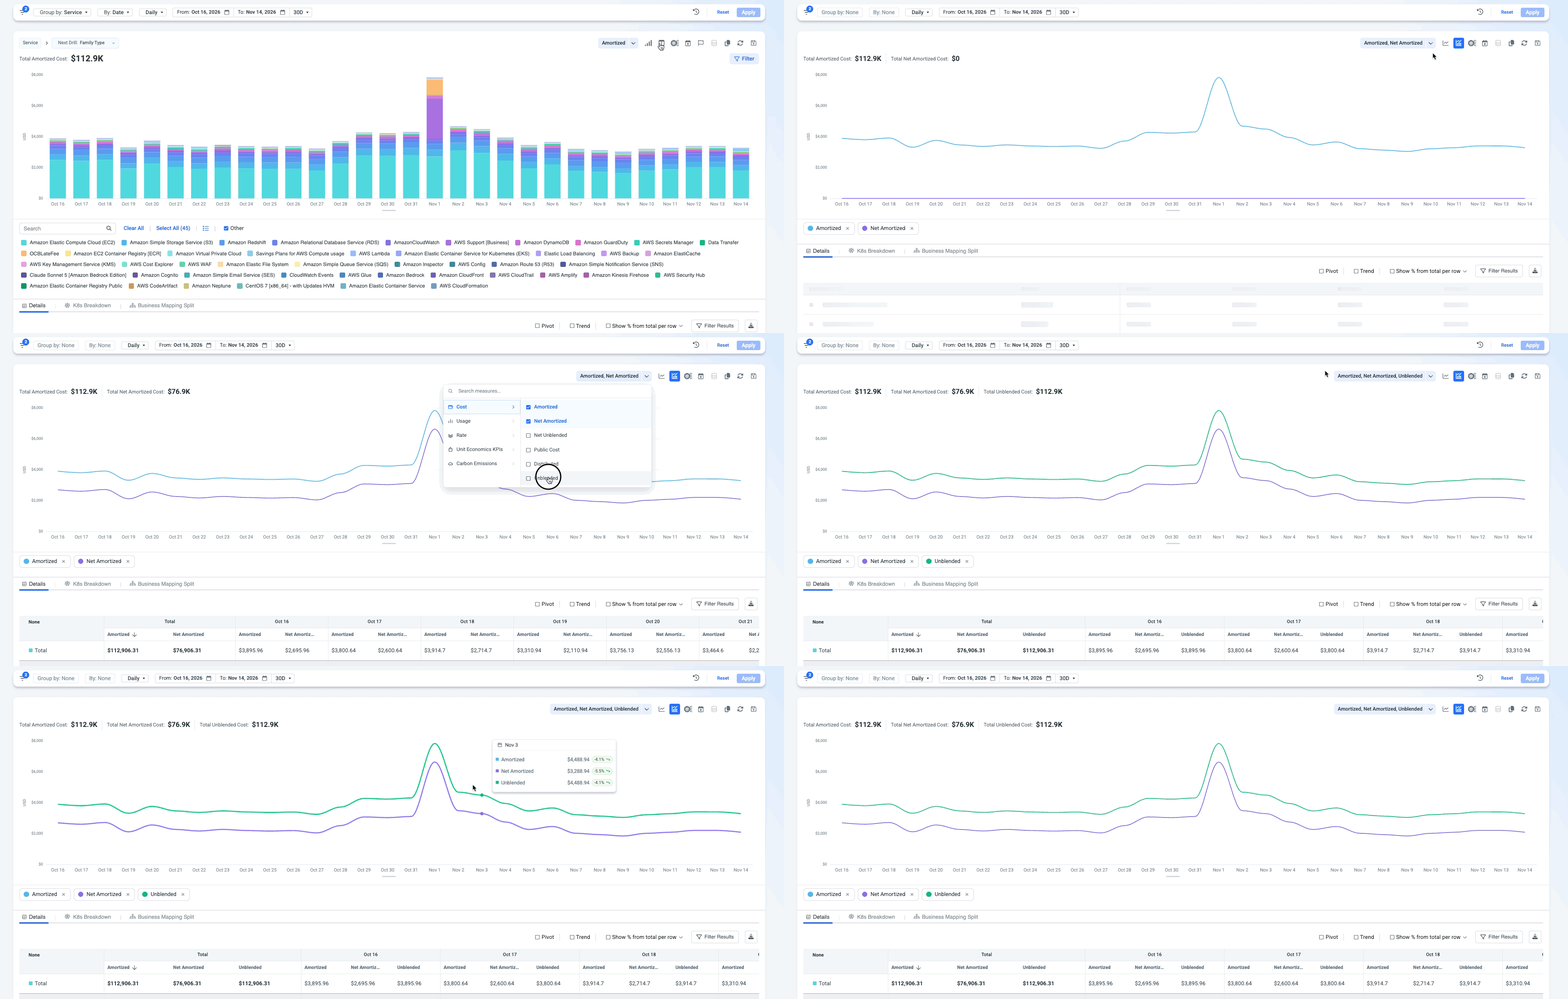
Show up to 10 measures on the same chart - for example, Amortized Cost, Unblended Cost, and Usage Hours for the EC2 service. Use it to see whether measures move together.
- Supported on Line, Grouped-Bar charts, and Table. Note that you can change each measure to be represented with a different chart view.
- Measures with the same unit share an axis. A second unit type gets the right axis. Hover a specific data point in order to see all the measures and their values.
- Click a legend item to mute a measure without removing it.
- The table shows one column per measure, grouped by service or by date. Cost and usage totals are summed; rates and percentages are averaged.
4. Compare time ranges
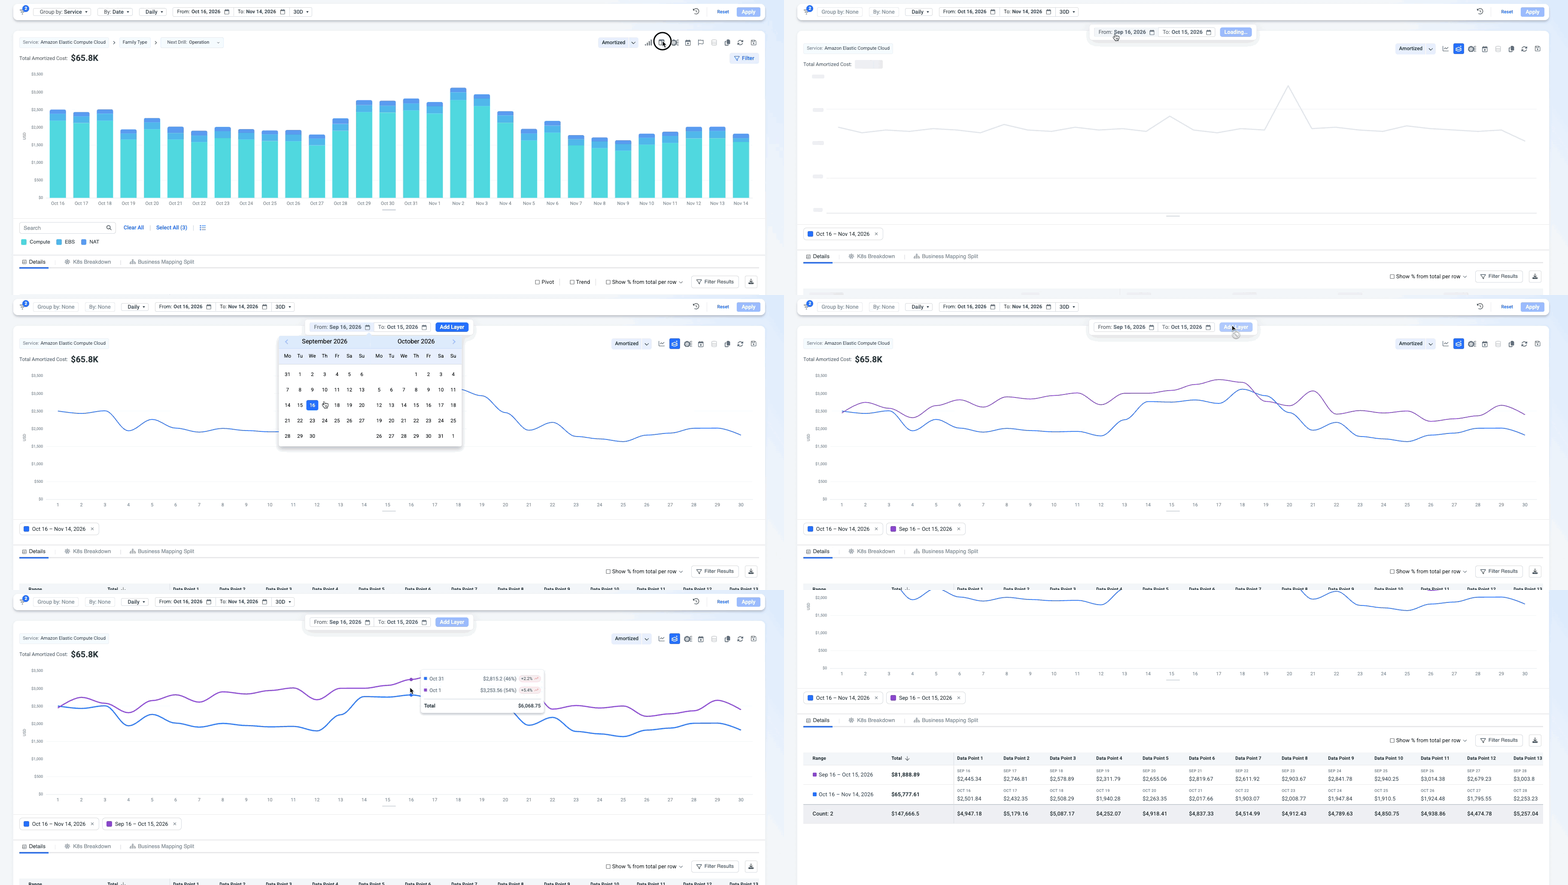
Compare the same view across different periods on one line chart - for example, Compute costs for the last 30 days against the same 30 days last year.
- Add up to 12 time ranges.
- Grouping switches to none while comparing.
- Can be saved to a dashboard.
Business Mapping split view
When you group by a Business Mapping that uses split costs, you can see exactly how shared costs were allocated.
Choose which costs to show. A chart menu option (next to Copy link) lets you show:
- Split cost + origin cost (default)
- Split cost only
This option is only active when a Business Mapping split view is selected.
Business Mapping Split tab. The last tab under the chart. Switch between:
- Sankey chart - the allocation flow, as on the Business Mapping page.
- Table - each allocation step with its breakdown. For example, Team C has $100: $50 from Product A and $50 from Product B. Breakdowns are shown by default and can be hidden per step. Includes changes in $ and % and CSV download.
If no Business Mapping split view is selected, the tab asks you to group by one.
Drill into a split cost. A drill option called Business Mapping Allocation path appears only when you group by a split Business Mapping. Click a value to see which allocations make it up.
Updated about 14 hours ago