Working with the K8s Cost & Usage Explorer
To control your Kubernetes cluster and node costs better, you need a better understanding of what you are paying for and where each dollar is going, including the cost per pod and cost per namespace. Umbrella Cost provides a unique Kubernetes Cost & Usage Explorer that gives you the ability to truly understand your billing and waste.
To access the Kubernetes Cost & Usage Explorer, in the left navigation bar, click Kubernetes > Cost & Usage Explorer.
NoteAs a preventive measure to avoid timeout for resource-heavy queries, query results within the Kubernetes Cost & Usage Explorer and Kubernetes Assets are limited to 500,000. This still allows a good amount of data to be shown. You are also prompted to refine your query if there are too many results, instead of not getting any data displayed.
Kubernetes Cost & Usage Explorer Features
The Kubernetes Cost & Usage Explorer provides a number of features that help you understand your billing, customize your display, and create advanced reports, including:
Grouping X by Y
You can select how to group costs by selecting up to two groupings from the Group By and By lists, including: cluster, region, linked account, cost center and user tags.

The two-levels of groupings enables you to group all clusters by, for example, date, linked accounts or nodes. For example:
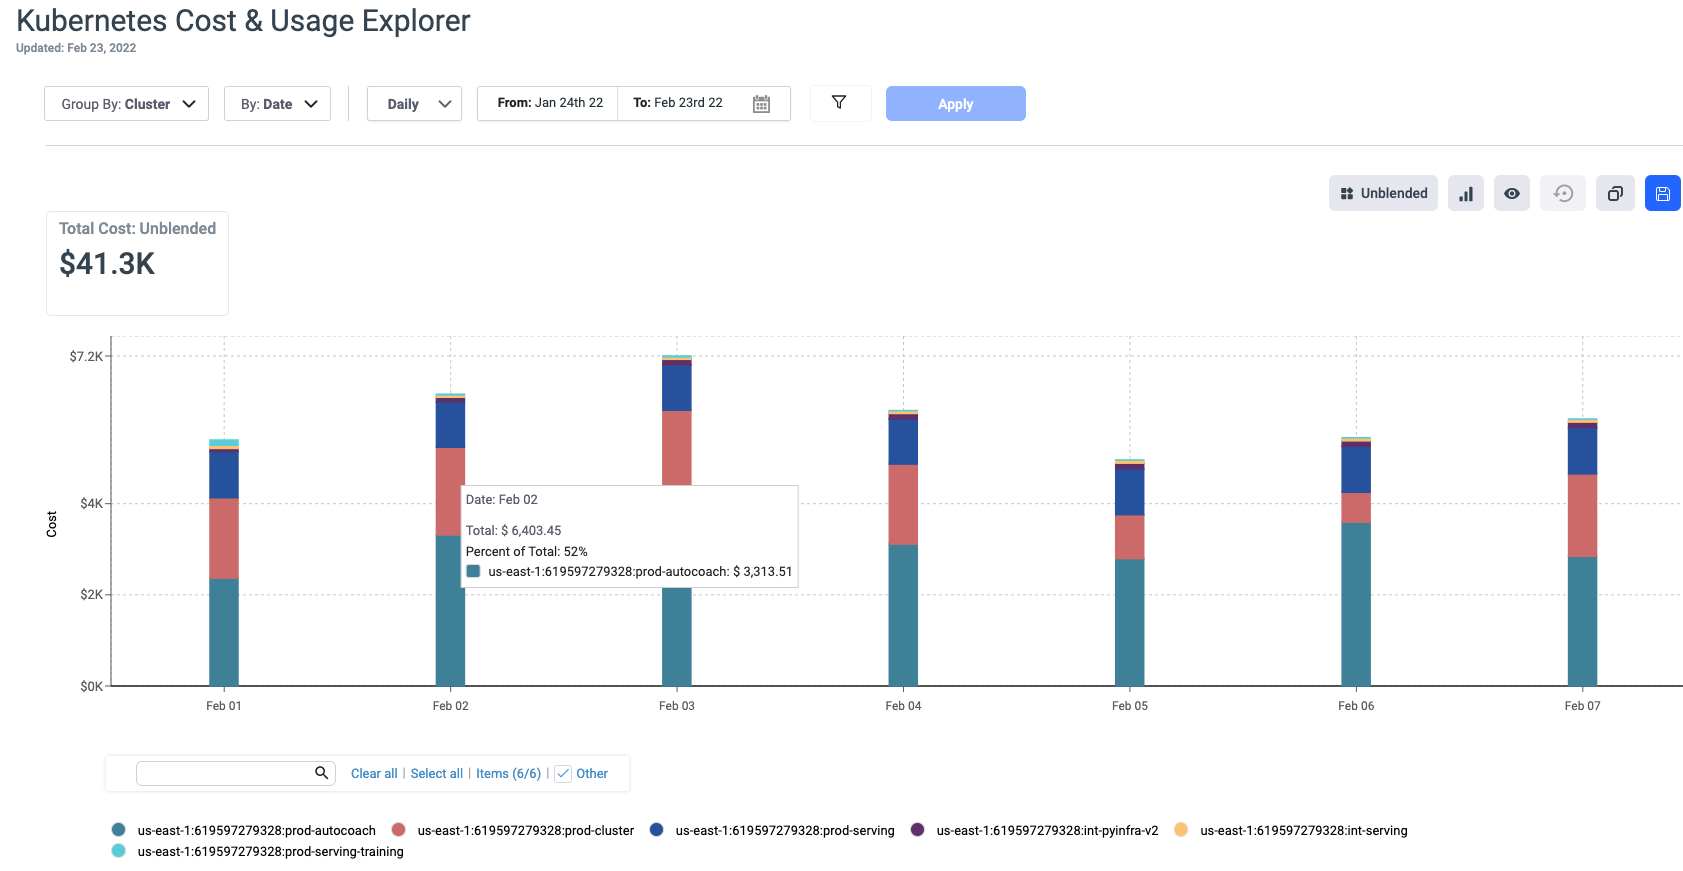
Note that if you select to group by Business Mapping Viewpoints, you will only be able to view Kubernetes Viewpoints. Any other Business Mapping Viewpoint can be viewed and grouped by in the regular Cost & Usage Explorer. For more information, see Working with Business Mapping Viewpoints.
After grouping your data, you can then deep dive into specific dates and nodes, as described in Deep Dive .
Filters
When you want to focus only on the cost of specific resources, you can filter the costs by Cluster, Node Group, Namespace, Linked Account, Region, Tags, and more. Each filter is multi-select, so you can select more than one value at a time.
Click the filter icon to display/close the list of available filters on the left of the Explorer window, as shown below. After selecting the relevant filters, click Apply. You can also click the Include link for each filter to exclude specific values for that filter.
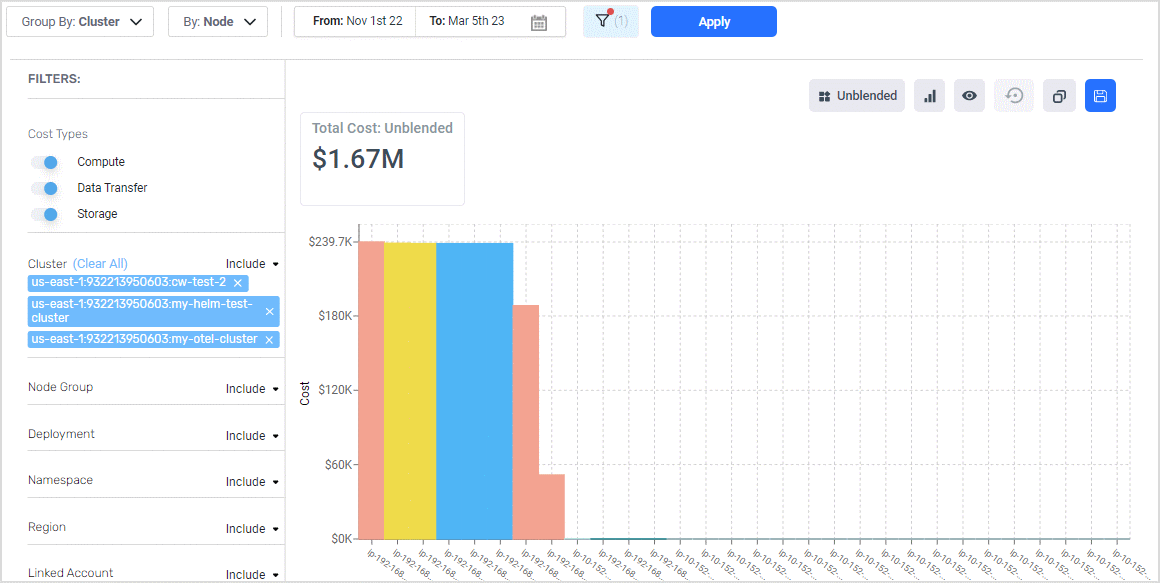
To reset the filters, click the Reset All icon.

By default, the Compute, Data Transfer, and Storage cost types are selected for all clusters, but they can be disabled. Note that the Cost Breakdown table at the bottom of the page will display these three cost types, whether or not they are selected in the filter section.

Deep dive
When the second group level is Date, you can deep dive into the chart by clicking on the relevant data on the chart. For example, when you want to dive into the data of a cluster and its nodes, you can click on the relevant cluster on the chart, as indicated below. In the next graph displayed, you will be able to deep dive into a specific node.

Waste Allocation
When deep-diving to the node level, you can also view the waste for a node, as shown below.
The waste can also be viewed from the View Options icon by selecting the Allocate Waste Cost option.
Detailed waste allocation logic explanation.
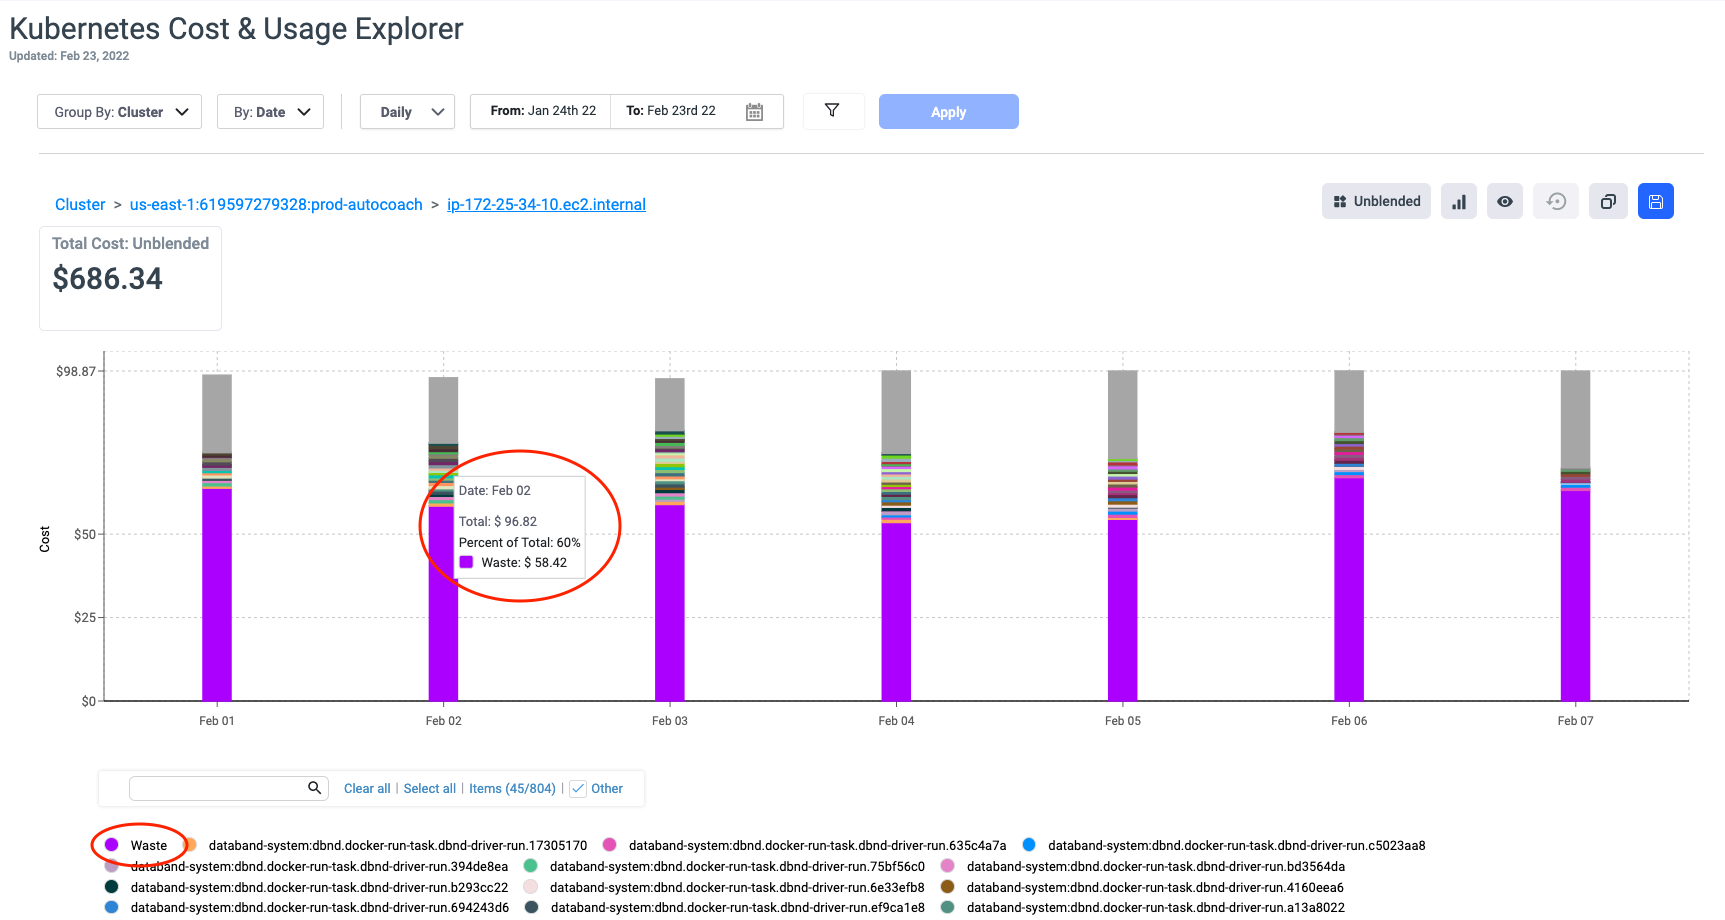
In the top-left corner, the Path bar displays your current location in the deep dive. You can explore further down to the Pod level, as shown below. To return to a previous step, simply click on the desired level in the Path bar.
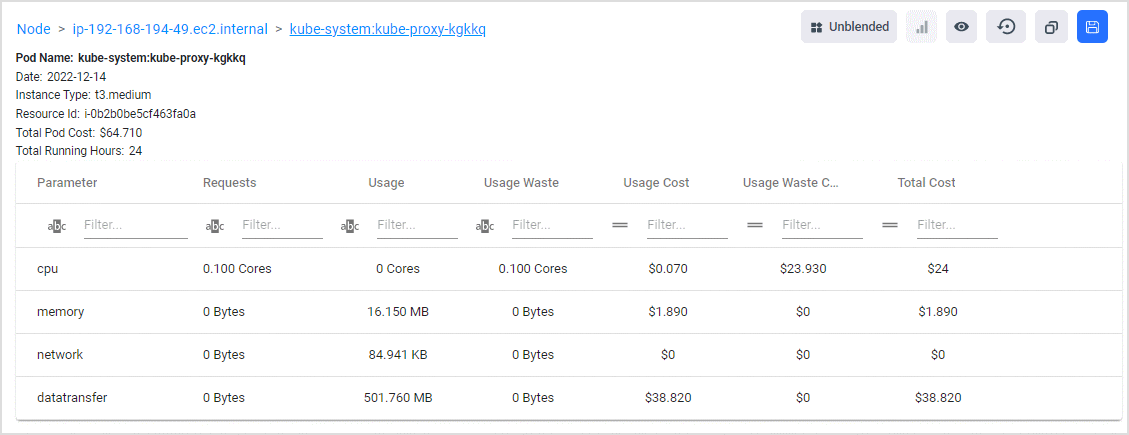
Legend
Use the legend at the bottom of the screen to drill down to specific dimensions such as clusters and nodes. You can click on an individual cluster/node to add/remove it from the displayed chart, or select Clear all and then select individual clusters/nodes as required.

Drildown Hierarchy
You can quickly navigate and drill down using the bar charts. The drill-down hierarchy is as follow: Cluster->Node->Namespace: workload->Pod
Legend glossary
-
Not allocated: Shown once grouping by a Namespace. It represents "node-level" waste because resources that are not allocated to any namespace originate from the unused part of the node.
-
Not available: Shown once grouping by a Node Group or Workload Type.
- In Node Group, it means that the node group information is not available (due to either not being part of a node-group, or the data was not available).
- In Workload Type, it means that the pods in this portion were not created by a Kubernetes workload (e.g. Deployment, DaemonSet, StatefulSet, etc.). This portion also represents the node-level waste.
-
no label: Shown once grouped by Labels, it represents the cost assigned to pods unlabelled with the selected label. This portion also represents the node-level waste.
-
no tag: Shown once grouped by Tags, (AWS only), it represents the cost assigned to nodes made of EC2s untagged with the selected label.
-
Other Workload Type: Other Workload Type when grouping by Workload: refers to pods under the workload types that are not selected, and to the same scope referred to by "Not Available" when grouping by Workload Type (see above).
-
Rest: Shown once grouping by a Node or Namespace. We present the 1-1000 highest costs/usage values and show them in the graph; all the rest is categorized at 'rest'. Presentation wise:
- The cost & usage graph presents the top 1-45 items by cost/usage by default.

The cost of all other items > 45 are grouped and presented as 'Other', the selection can be changed and expanded. The full list of items 1-1000 is presented in the selection box and by default, the top 45 items are selected.

- Rest of the items ranked higher than 1000 are grouped into a single 'Rest' item with aggregated cost. The 'Rest' item can't be separated into an individual like happens in the 'Other'.
-
Other - The cost & usage graph presents the top 1-45 items by cost/usage by default.

- The cost of all other items > 45 are grouped and presented as 'Other', the selection can be changed and expanded. The full list of all items is presented in the selection box.

Workload & Workload Type
Workload lets you group by the different workloads, so that you can view all your different Deployments, StatefulSets, DaemonSets, in a single view, regardless of its kind. Workload Type on the other hand provides less detailed view, where all the Deployments, StatefulSets, DaemonSets are grouped under the same kind.
In the K8s CUE, you can filter & group by :
-
The Workload type as a group and see the overall cost or filter by the type.

-
The Workload values, where you can select the workload type corresponding to your workload value, with multi-selection.

Data Shape
Umbrella Cost enables you to quickly switch between different representations, by selecting the relevant option from the Graph Options list, as shown below. Note that the actual icon shown on the Graph Options button changes according to the option selected.
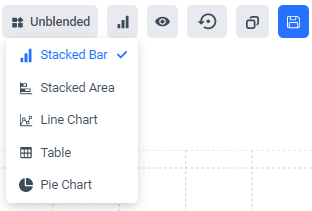
Table
The Table display (accessed from the Graph Options button) has a filter feature that enables you to display the data in different ways. You can use either string or number filters, as indicated below. Click on the filter icon to select the relevant filter option.
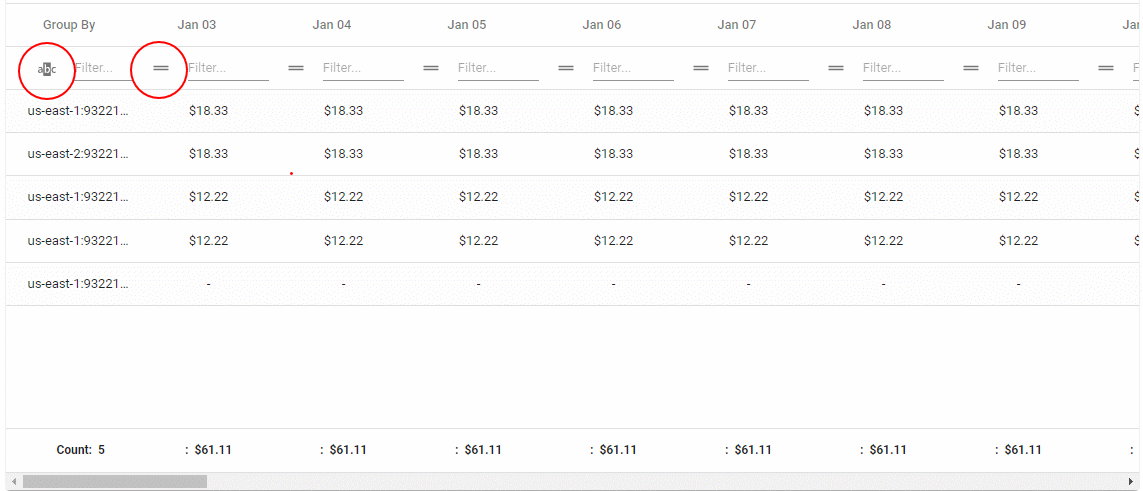
String filter options Number filter options

You can select the column(s) you want to show on the the table by clicking on the icon on the right side of the chart.

Usage
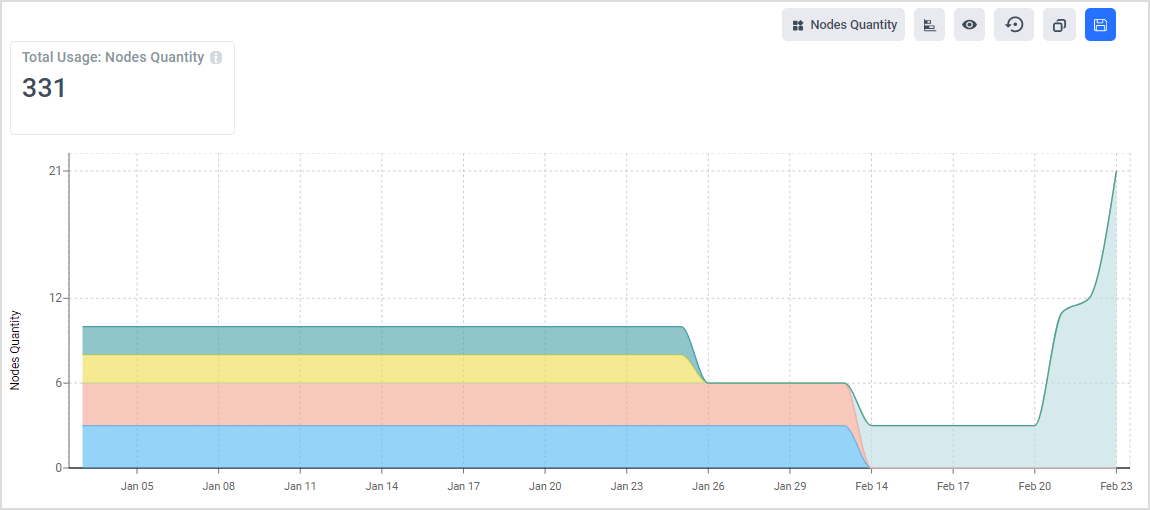
The Kubernetes Cost & Usage Explorer enables you to analyze usage, as well as cost. When you click on the Usage toggle you need to select which quantity type you want to see.
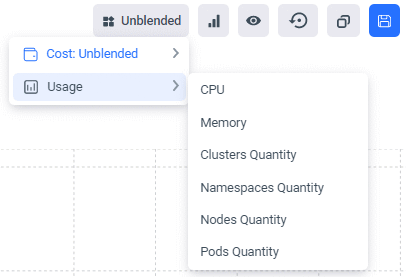
As shown below, you can see the number of nodes you have for each cluster, by selecting Usage > Nodes Quantity.
Goals
Use the Goals feature to monitor your cost metrics more closely by showing a “goal” on top of your usage stats. This enables you to compare actual to planned cost/usage, and, in turn, set an alert for when a specific goal is reached.
To access Goals, click the View Options button, and then select Show Goal. In the displayed list of Goals, click on the Goal you want to display (note that only one Goal can be displayed at any one time).
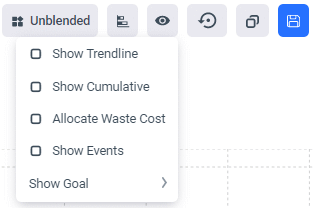
You can create a new Goal by clicking the Save & Export Options button, and then selecting Save as Goal > Create new.
Updated 11 months ago
