Waste Detector
Overview
Recommendations are an important element within Umbrella Cost, and reflect potential savings and actionable suggestions to save waste.
Umbrella provides several types of recommendations. Some are provided by the CSP, others are based on the analysis done by Umbrella.
The new Waste Detector interface enables
- Filtering the recommendations by preset status filters or custom filters
- Easy slice and dice of the potential savings according to a number of dimensions, such as service, region, tags and many more.
- You can arrange the most relevant dimensions to be presented and hide less relevant ones
- The information is sorted according to the potential savings or the number of recommendations
- Easy slice and dice of your completed recommendations (Previously referred to as the history) using similar or other dimensions
- Tracking your waste target compliance in a designated period
Savings calculation (Potential Savings/Actual Savings) is calculated based on Public Cost
Recommendation life cycle
The recommendation life-cycle has two properties, an Umbrella managed status, which is the automated part, and a manual status which is managed by the user.
| Status | Description | Update Type |
|---|---|---|
| Open | Ready for users to review and act upon | Automatic |
| Completed | A recommendation that was performed. When the resource has changed in a different manner. A close reason indication will be added to such a recommendation. | Automatic |
| Done | Marked by a user a Done. 'Done' recommendations will be calculated into the 'Actual Savings" | Manual |
| Excluded | Marked by a user as excluded. 'Excluded' recommendations will be removed from the 'potential savings' | Manual |
Waste Detector Sections
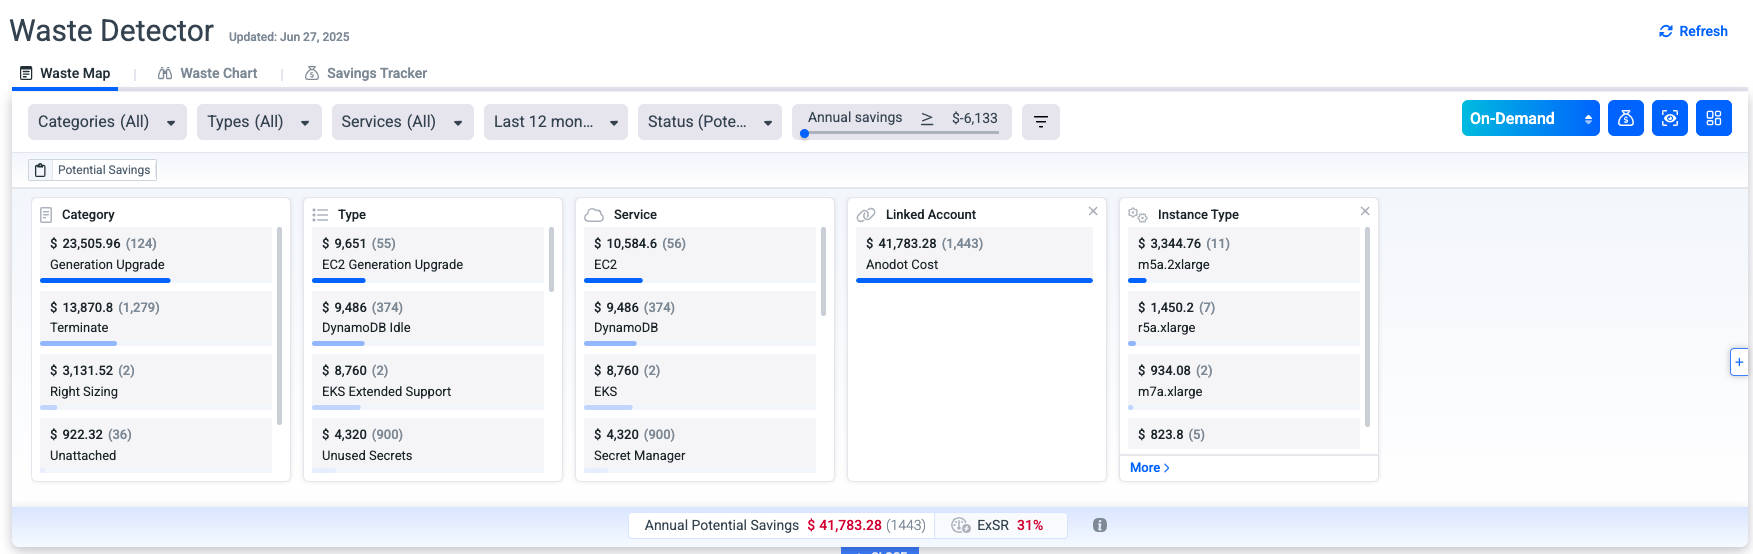
Waste Map
- View the dimensions most relevant to you by adding them to the main display, hiding less relevant dimensions.
- Use the built in heatmap to see the recommendations grouped by their total sum or count.
- Click on an item in the heatmap to filter by that item
- The summary line sums the total Potential savings and Actual savings based on your filters
Date range impact over the summary line
The date range affects the recommendation lines included in the presented output.
For each recommendation that is included in filtering & date range, umbrella calculates the following:
- Monthly potential savings
- Annual potential savings
The summary line is the total of all Annual potential saving entries included in the filtering and date range output.
Waste Chart
- The status filter (see below) is set to Potential Savings
- View the waste per recommendation type and service
- View your target waste and over-waste figures
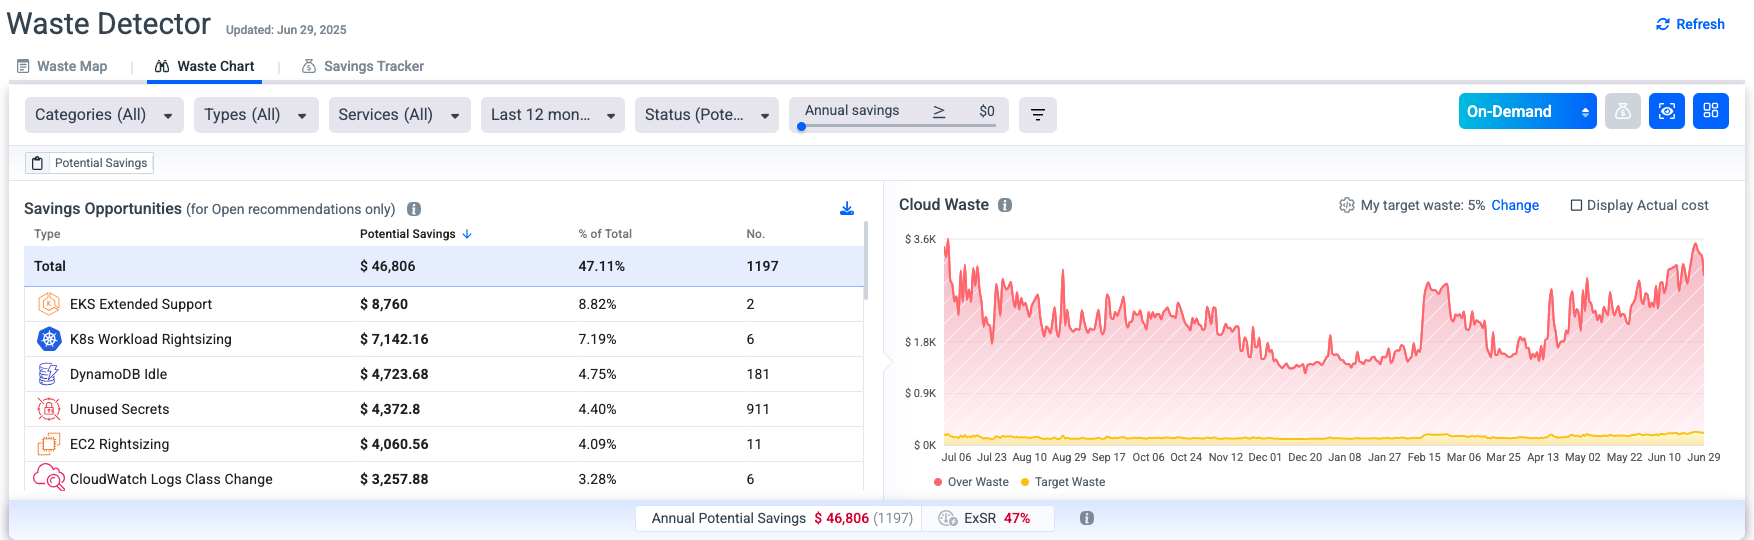
The waste chart explained
- Actual cost - The amount paid per day for the relevant service or the total cost excluding support, Marketplace, Discounts, and RI-Fee.
The actual cost is calculated from the processed invoice, it contains costs of resources with and without active recommendations.
AWS - Excluding RI and support service items
Azure - Excluding marketplace
GCP - Excluding support
- Potential Savings - The available saving opportunities, this figure is calculated from the relevant recommendations.
- The waste chart takes into account all non-excluded recommendations (Open, Done, Completed) to track the historical waste as well as future waste.
- Waste percent - The percentage of waste from the actual cost. Defined as 5% in the image above.
- Target waste - Your organization's waste within the target.
- This is calculated as the waste percent out of the Actual cost listed above.
- Over waste - The waste beyond the target waste.
- Calculated by reducing the target waste from the potential savings.
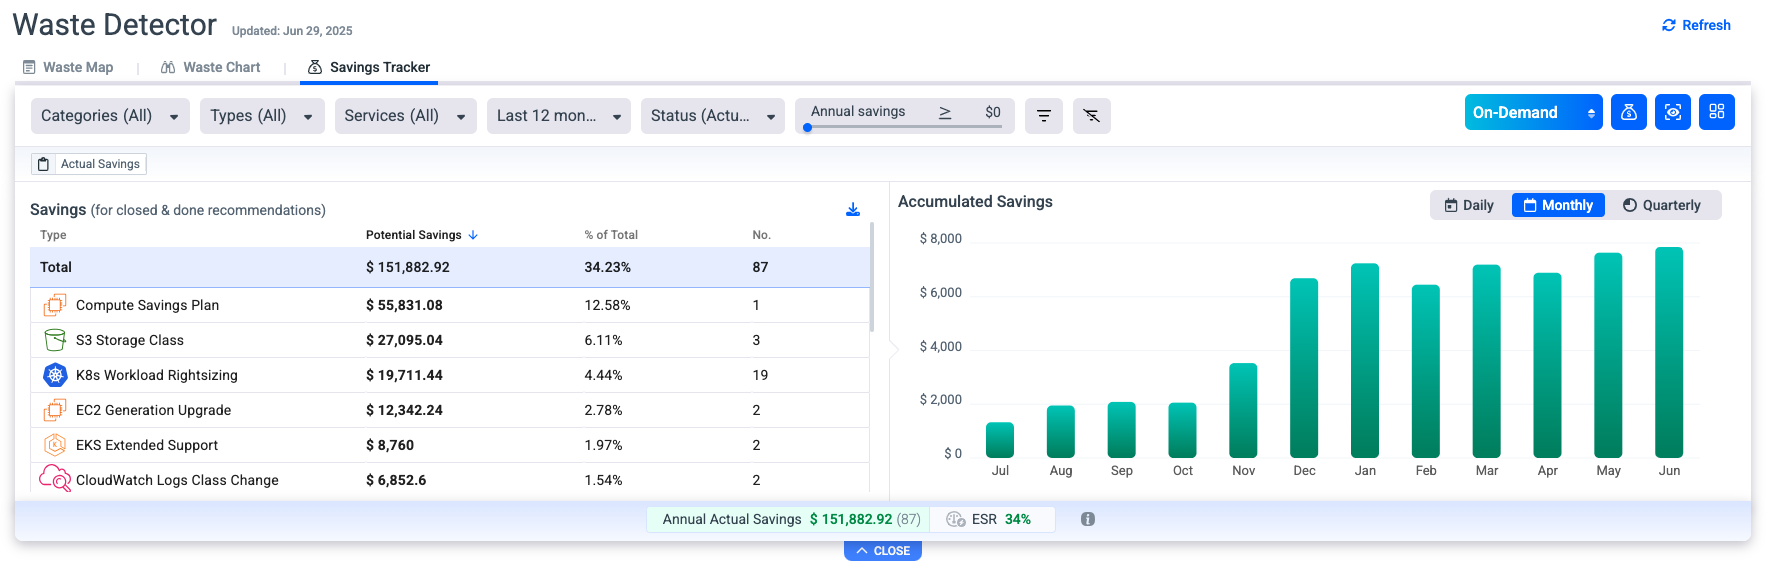
Savings Tracker
The Savings Tracker provides visibility into how much value has been unlocked over time, enabling teams to assess performance, drive accountability, and support FinOps goals.
Note
- The presented savings are accumulatedper day, month and quarter.
- Filtering 'Creation date' won't filter the savings.
🧩 Key Capabilities
- Savings Overview Dashboard: View total potential savings, savings already realized, and opportunities still pending.
- Time-Based Tracking: Monitor savings progress over time (daily, weekly, or monthly), including before and after a recommendation is applied.
- Status Management: Track the lifecycle of each recommendation—open, dismissed, or implemented.
- Attribution and Ownership: Assign savings to specific teams, accounts, or projects to drive ownership and accountability.
✅ Savings Tracking Logic
Umbrella saving tracker is spreading the savings across the year, allocating the savings proportionally over the remaining period (daily or monthly).
This reflects continuous savings accrual, rather than a one-time event.
For example
- Instance was deleted on 16/07/2025
- Annual potential savings = $5,000
- Monthly savings = $416.16 (≈ $5,000 ÷ 12)
- Daily savings = $13.70 (≈ $5,000 ÷ 365)
Daily Tracking
The actual savings is computed as follows:
- From 16/07/2025 to 31/12/2025 → 169 days
- Date Daily Savings
2025-07-16 $13.70
2025-07-17 $13.70
... ...
2025-12-31 $13.70Monthly Tracking
Spread the $416.16 proportionally for July (16–31), then full for Aug–Dec.
- Month Days Active Savings
July 2025 16 days 16 × $13.70 = $219.20
August 31 days 31 × $13.70 = $424.70
... ... ...
December 31 days $424.70
The Summary Line
Please note that all figures in the summary line are based on the recommendation information and the filters you have chosen to filter the recommendations by.
If you are looking for the total cost regardless of recommendations, please view the information in the CUE.
| Summary line item | Description |
|---|---|
| Annual Potential Savings | Annual summary of all potential savings from the open recommendations |
| ExSR | Annual potential savings divided by the current cost of the open recommendations |
| Annual Actual Savings | Annual summary of savings from all completed or done recommendations |
| ESR | Annual Actual Savings divided by the current cost (cost prior to recommendation) of the complete or done recommendations |
| Excluded | Annual summary of excluded recommendations |
On-Demand & Net Amortized view
Toggle between viewing the savings according to actual usage and on-demand pricing based on the public cost, and the savings based on Net Amortized calculations.

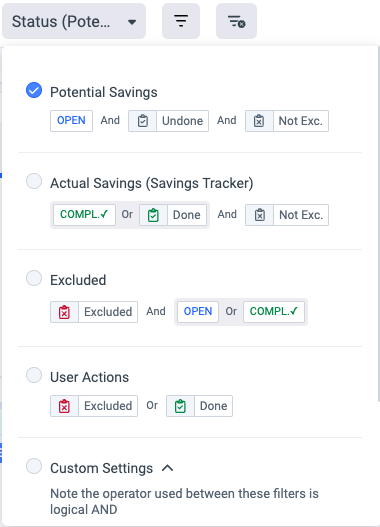
Status Filters
Use the status preset filters to get things done.
- Potential Savings - That's your To-Do list. These are the Open recommendations that need to be worked on.
- Actual Savings - That's your done list. These are the automatically completed or manually marked as done items. These are your historical savings.
- Excluded - That's your deferred list. All the items you have marked for exclusion for any reason.
- User Actions - These are the items touched by anyone, either to mark as done, or as excluded.
- Custom Settings - Choose other combinations based on your needs.
Additional filters
- Use the additional filters to filter by any combination of properties, including tags and values
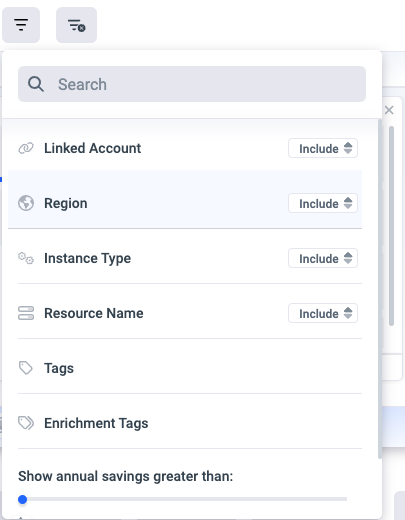
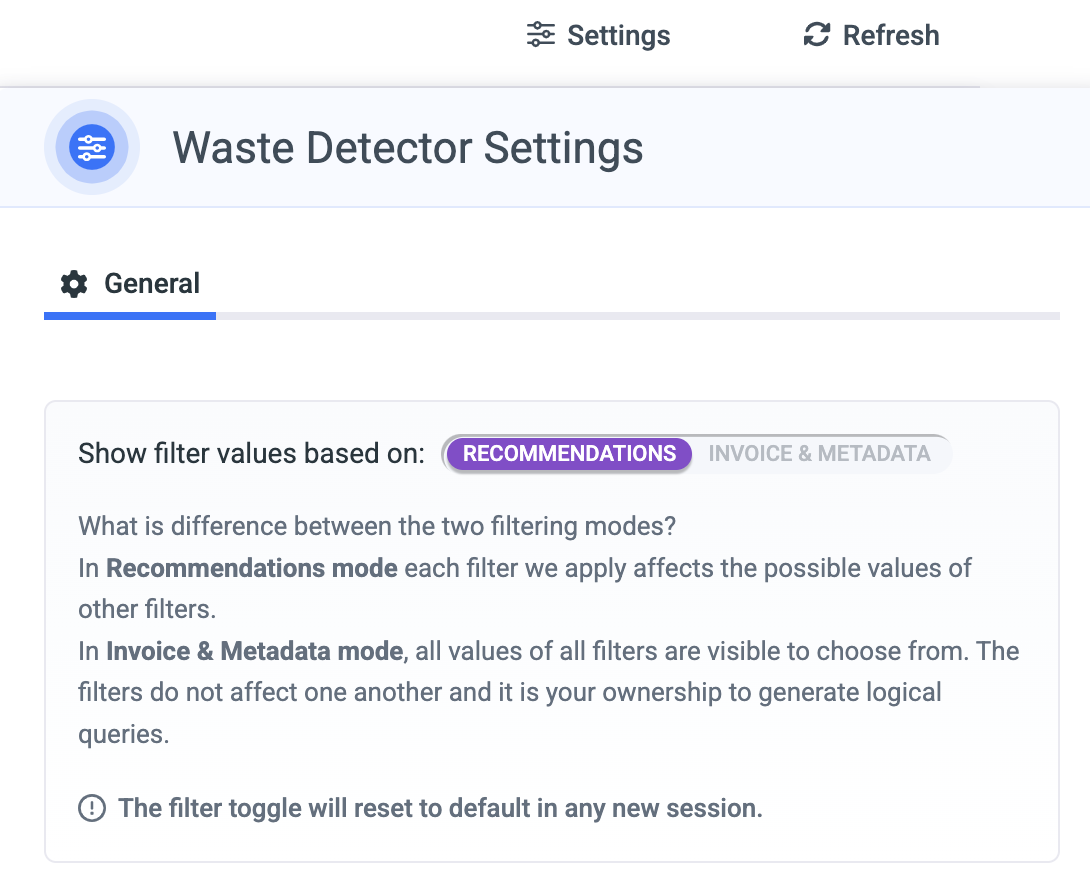
Filter Setting
Switch filter mode to view all available filter values.
What is difference between the two filtering modes?
- In Recommendations mode each filter we apply affects the possible values of other filters.
- In Invoice & Metadata mode, all values of all filters are visible to choose from. The filters do not affect one another and it is your ownership to generate logical queries.
TIpTo create dashboard panels as placeholders for recommendations that have not yet been triggered, or for Regions, Linked accounts, Instance Types, Tags, or enrichment tags that currently lack associated recommendations, select the "Invoice & Metadata" mode.
The filter toggle will reset to default in any new session.
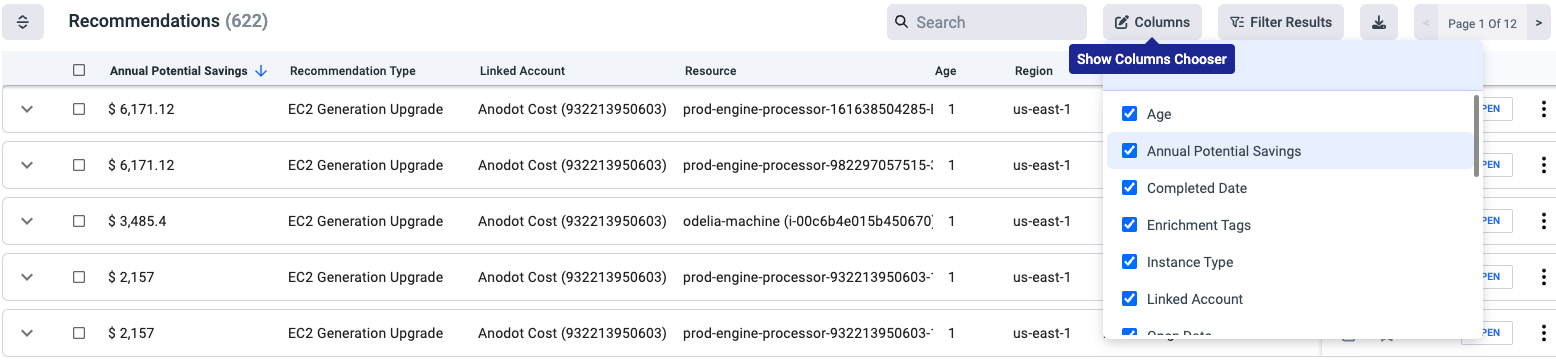
Recommendation List
The recommendations are listed below based on your filters
Click the 'Columns' button to choose the properties you wish to view in the recommendation table
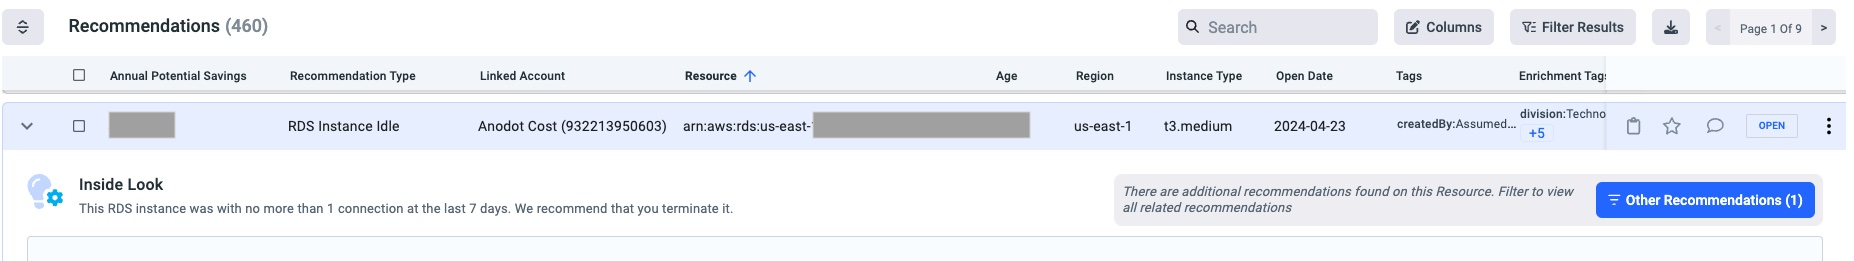
Recommendation Details
Multiple recommendations per resource
Some resources might have more than one recommendation relevant to them. In such cases, the information will be highlighted on that resource, and allow you to filter the recommendations on that resource
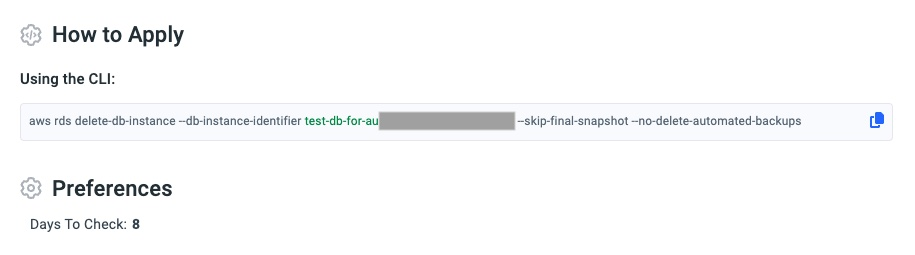
How to apply the recommendation
Copy the command to your own scripts to apply the recommendation in your environment
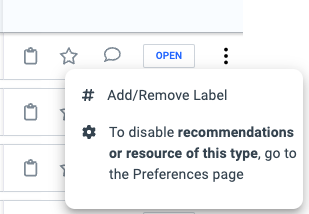
User Actions on a Recommendation
- Mark the recommendation as 'Done' or 'Excluded'
- Star it for future filtering
- Add a comment
- Add a label
- Go to the preferences page to disable this recommendation type altogether
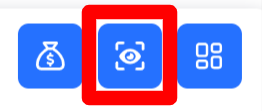
Additional features
- Savings Tracker: Click on the following icon to see all of your savings (recommendations with status 'done' or 'completed')

-
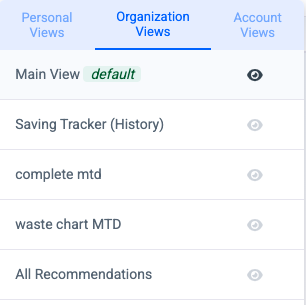
Creating Views: After applying your unique filters, simply click the following icon to save the filtered view for future use instead of creating it every time. In addition, you can set a custom view as a default view of the Waste Detector page. The user can create the views under 3 different views types and each will make it available for different audiences:
-
Personal Views- These views will be available only for the user who created them.
-
Organization Views- These views will be available across all accounts of the same cloud provider, and in the case of an MSP also to his customers.
-
Account Views- These views will be available to the specific account they were created from.
-
- Save as a panel: Click on the following icon to save it as a dashboard panel.
Business Mapping filter
The Waste Detector now supports the Business Mapping filter, allowing waste recommendations to be associated with business dimensions such as customer, project, application, cost center, or any custom business entity defined in the platform. This enables more accurate ownership, accountability, and reporting of identified waste across the organization.
Business mapping is applied as part of the recommendation calculation during invoice processing. During each invoice run, the system evaluates the relevant usage and cost data and associates the appropriate business mapping to each generated recommendation.
The business mapping association is made by matching the resource referenced in the recommendation to the resources linked to the business mapping. This association is evaluated as part of the recommendation calculation during invoice processing, ensuring that each recommendation is aligned with the relevant business context based on the underlying resource.
Important Note
- The association between a recommendation and its business mapping is calculated only at invoice processing time.
- As a result, if a business mapping is created or updated after the invoice has already been processed, it will not be reflected in existing Waste Detector recommendations. The updated mapping will be applied only in the next invoice processing cycle, when recommendations are recalculated.
This approach ensures consistency between invoiced data and recommendation logic, while keeping business attribution aligned with the exact cost and usage context at the time the recommendation is generated.
Waste detector in All Accounts and MultiCloud
Waste Detector is now available in the Multi-Cloud and All-Accounts scopes, giving you a unified view of every savings opportunity across all accounts under a cloud provider in one place. Instead of reviewing recommendations account by account, you can see and act on them together.
AvailabilityMulti-Cloud and All-Accounts scopes in User Management 2.0.
How actions and views sync
Actions taken on a recommendation - such as dismissing or assigning it - are synced across the All-Accounts, Multi-Cloud, and individual account views, so a recommendation stays consistent everywhere it appears.
Views behave differentlyViews created in an individual account appear in the Multi-Cloud and All-Accounts scopes. Views created in Multi-Cloud or All-Accounts do not propagate down to individual accounts.
Updated about 1 month ago