My Commitments-Reservations
Overview
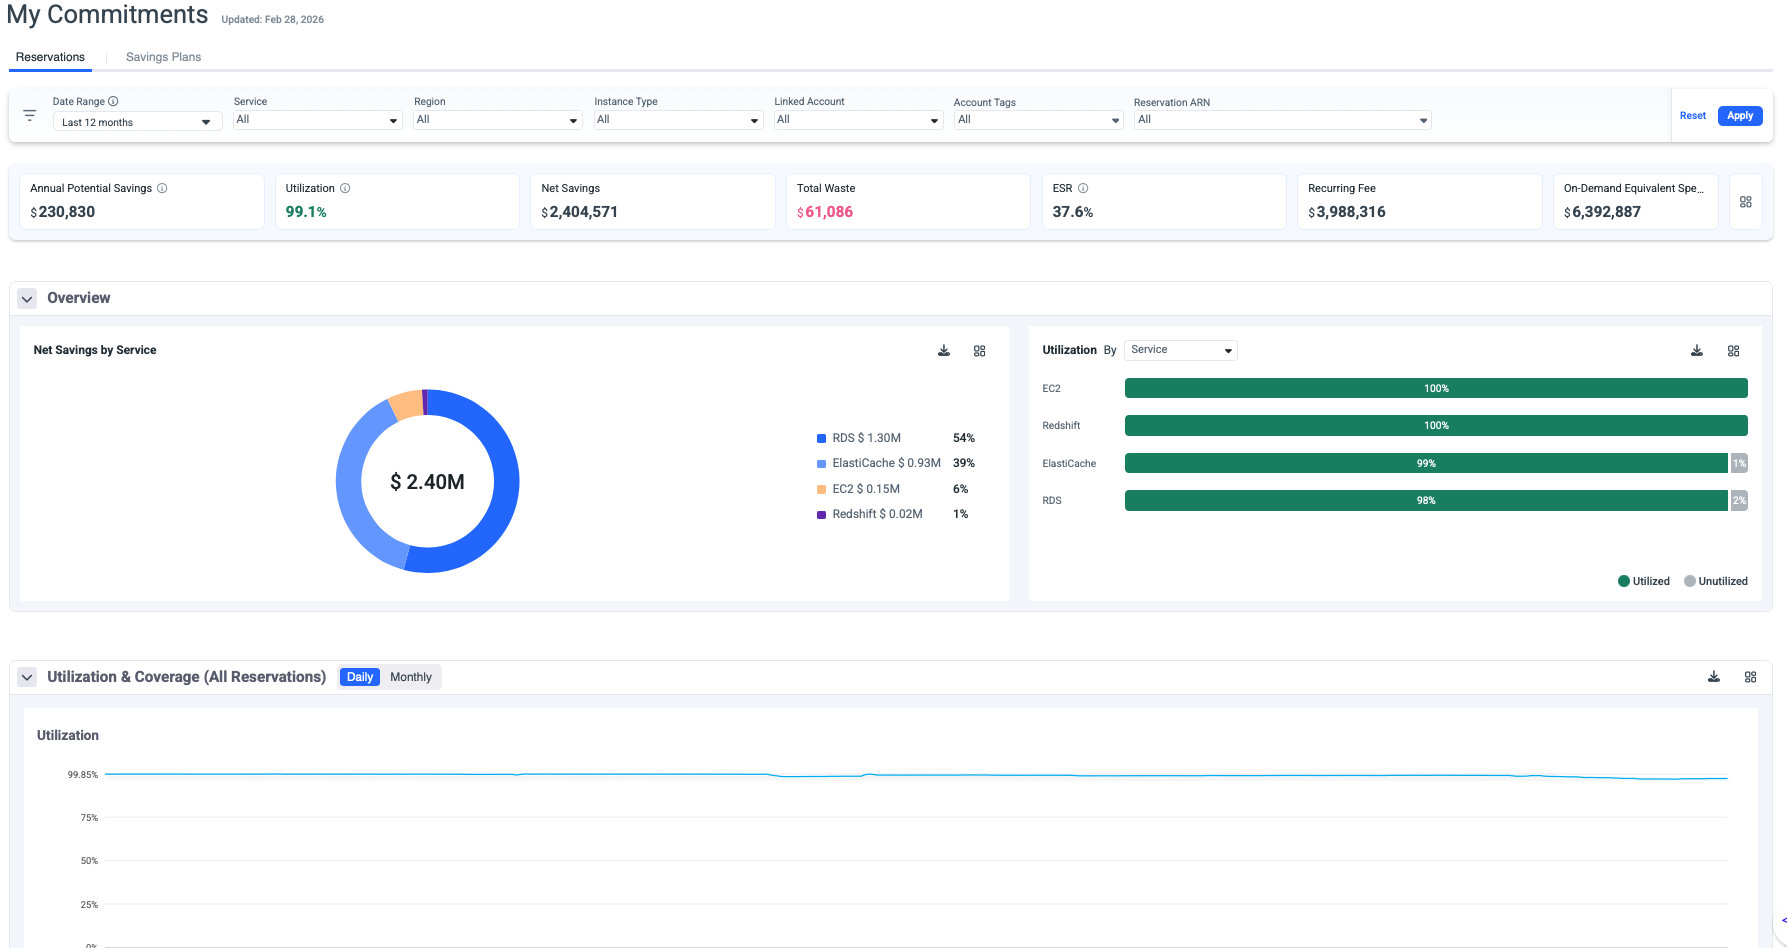
The Reservations page provides comprehensive monitoring and analysis of your AWS Reserved Instances performance, status, and inventory. This dashboard enables you to track utilization and coverage rates, identify optimization opportunities, and maximize cost savings across your AWS infrastructure.
Key Capabilities
Real-Time Performance Monitoring
- Track utilization and coverage metrics across all active reservations.
- Monitor net savings and waste in real-time.
- View Effective Savings Rate (ESR) to measure overall performance.
- Compare on-demand equivalent costs against actual spending.
Multi-Dimensional Filtering
Access granular views of your reservations through customizable filters:
- Date Range: Analyze historical trends or focus on specific periods.
- Service: Filter by AWS Services to understand service cost distribution.
- Region: Filter by AWS region to understand geographic cost distribution.
- Linked Account: View utilization across organizational accounts.
- Instance Type: Filter by Compute, EC2 Instance, DataBases or SageMaker plans.
- Account Tags: Group and analyze by custom tagging strategies.
- Reservations ARN: Drill down to individual plan performance.
- Customer: The filter is also available for MSPs.

Dashboard Metrics

Tips
- The metrics correspond to the selected filters.
- The metrics panel can be saved as dashboard panels.
-
Annual Potential Savings: Represent the annual savings derived from the Reserved Instance recommendation if it exists in the waste detector for the chosen set of filters.
-
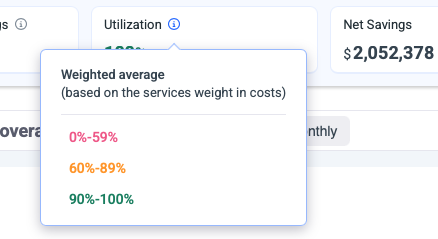
Utilization: Utilization weighted average, based on the metrics utilization consumed from AWS.
-
Net Savings: Total actual savings realized from your reservations.
-
Total Waste: Unused commitment costs (indicates underutilization).
-
ESR: Effective Savings Rate (ESR) measures the actual percentage saved compared to On-Demand pricing across all your reservations.
-
Recurring Fee: Total ongoing commitment costs across all plans.
-
On-Demand Equivalent: What these resources would cost at on-demand rates.
Performance Graphs
Utilization Graph
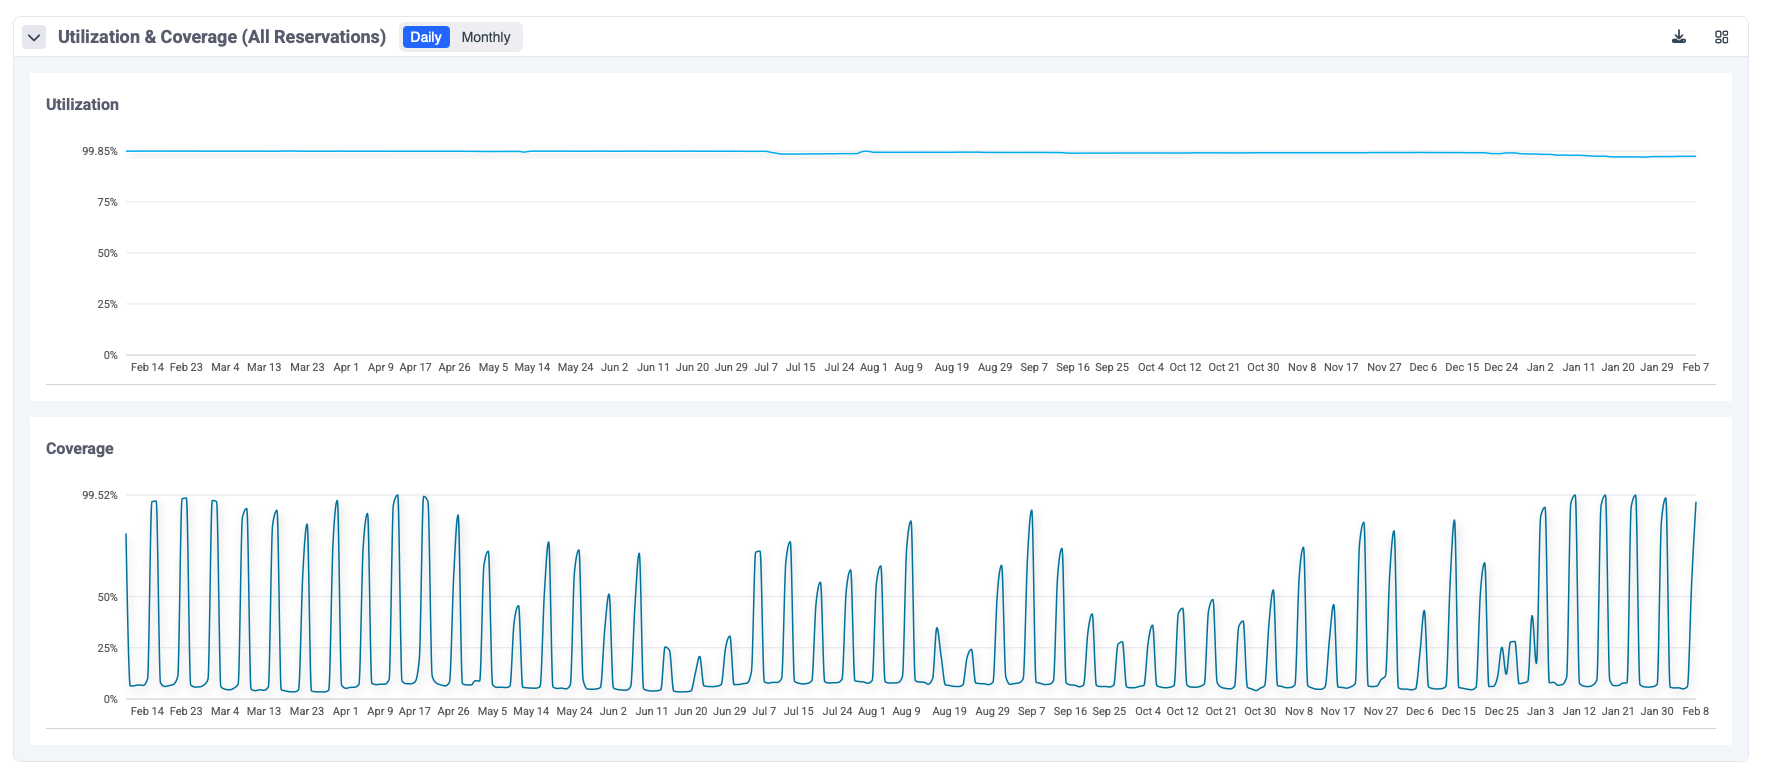
The utilization graph displays the Daily/Monthly utilization percentage over time. and helps identify usage patterns and trends. Supports daily and monthly views.
- Umbrella is using AWS GET RI Utilization API to retrieve the utilization data per all plans combined and per the plan.
Required permissions ce:GetReservationUtilization.
Coverage Graph
The coverage graph tracks coverage stability over time and shows the percentage of eligible usage covered by Reserved Insurance commitments.
- Umbrella is using AWS GET RI Coverage API to retrieve the utilization data per all plans combined and per the plan.
Required permissions ce:GetReservationCoverage.
Tips
The graphs can be saved as dashboard panels
Reservations Table
- The table can be filtered by Active, Expired this month, and Expired.
- Click on any Reserved Instance row to expand detailed information:
- Details: Full commitment details
- Chargeback: List of resources consuming this Reserved Instance commitment
- Overview Charges: Utilization breakdown for this Reserved Instance commitment
- RI Flexibility: This view helps you validate RI flexibility behavior, understand where the reservation discount is applied, and identify whether flexible RIs are being effectively utilized across eligible resources and accounts.
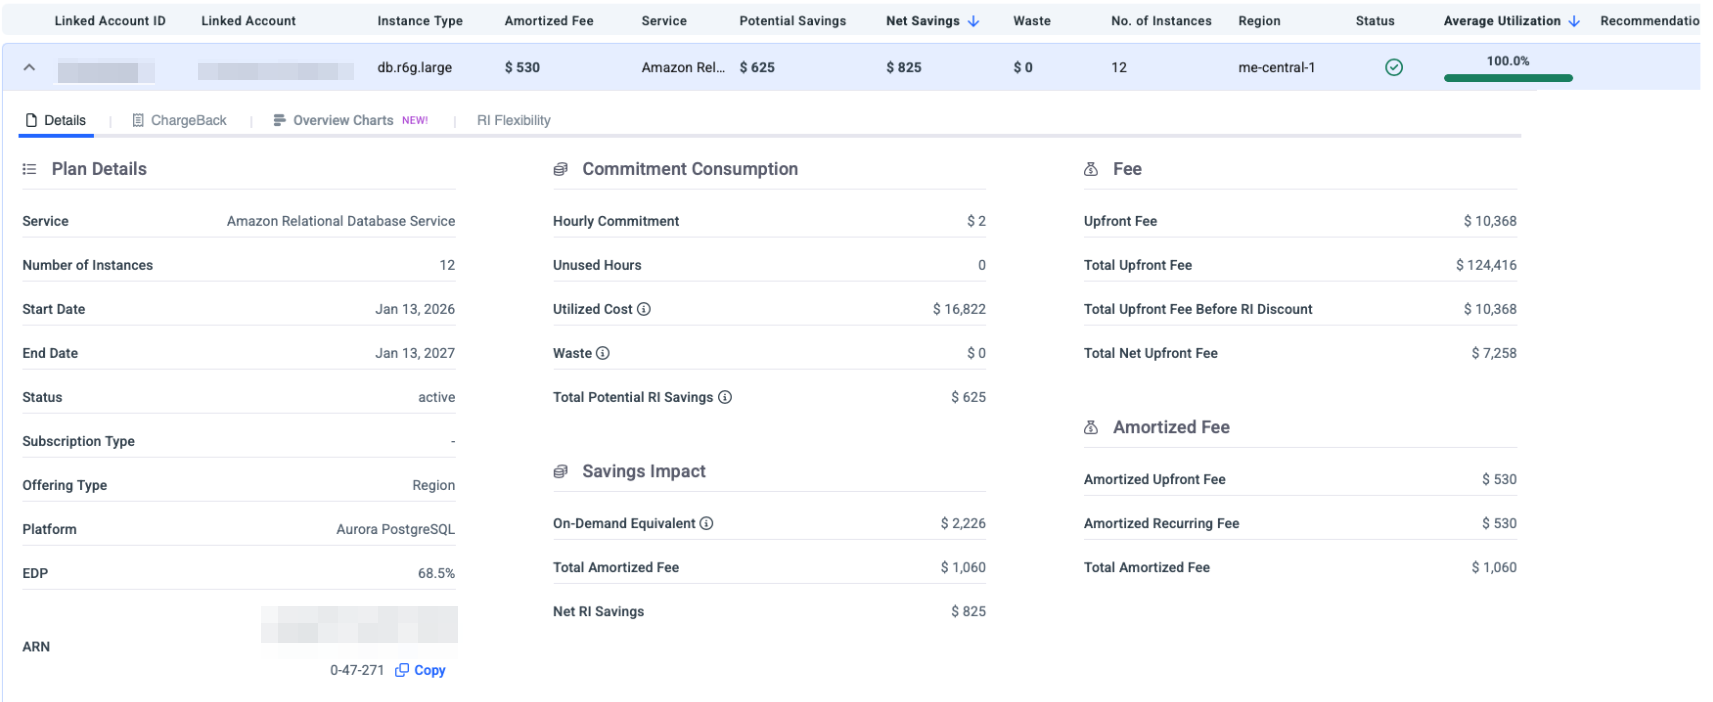
Detailed Plan View
Click on any Reserved Instance row to expand detailed information:
- Details: Full commitment details
- Chargeback: List of resources consuming this Reserved Instance commitment
- Overview Charges: Utilization breakdown for this Reserved Instance commitment
- The detailed table view provides plan-level insights:
-
Linked Account Name: AWS account associated with the plan.
-
Service: The service covered by this plan.
-
Purchase Option: Payment structure (No Upfront, Partial Upfront, All Upfront).
-
Purchase Term: Commitment duration (1 Year or 3 Years)
-
Number of Instances: Number of Instances covered by this plan.
-
Net Savings: Actual savings generated by this plan.
-
Waste: Unused commitment costs.
-
Status: Plan health indicator (Active, Expired).
-
Start Date: When the RI term began.
-
End Date: When the RI term expires.
-
Utilization: Current utilization percentage with visual indicator
🟢 Green checkmark: Healthy utilization (typically >90%) 🟡 Yellow warning: Moderate utilization concerns 🔴 Red alert: Significant underutilization
-
Total Potential RI Savings: The maximum possible savings over the full RI term compared to on-demand pricing. This is the total discount the RI provides.
-
On-Demand Equivalent: What you would have paid at on-demand rates for the same usage consumed so far.
-
Total Amortized Fee: The total RI cost is spread evenly over the period consumed so far.
-
Net RI Savings: Actual money saved so far =On-Demand Equivalent − Total RI Cost incurred to date, taking into account other discounts such as EDP.
-
Potential Savings: Total potential savings over the full term.
-
Net Savings: Realized savings to date (Public Cost - Net Amortized).
-
Waste: No unused capacity.
-
Average Utilization: = Used Hours / Total Available Hours × 100
-
ChargeBack
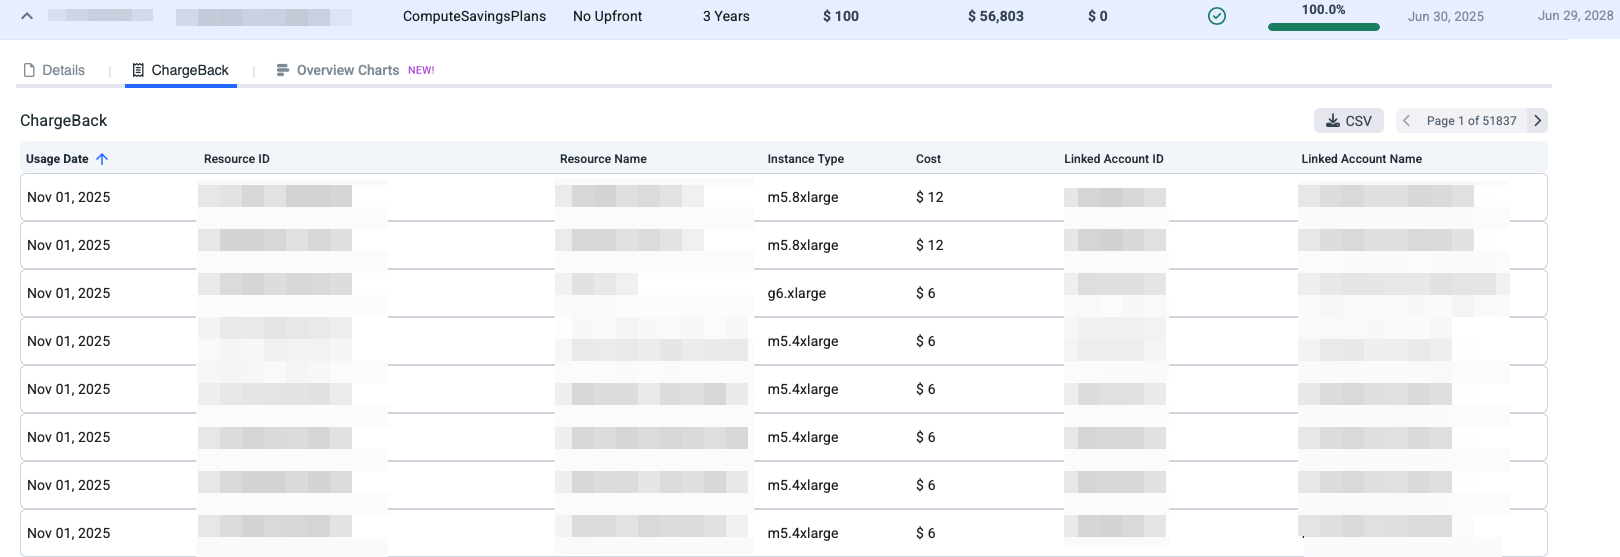
The Chargeback view shows how a Reserved Instance commitment is consumed across your AWS resources. Each resource is charged based on its actual usage that benefited from the Reserved Instance.
With the Chargeback view, you can:
- See which resources consumed the Reserved Instance.
- Understand how much of the commitment was applied to each resource.
- Accurately allocate discounted costs for chargeback or showback purposes.
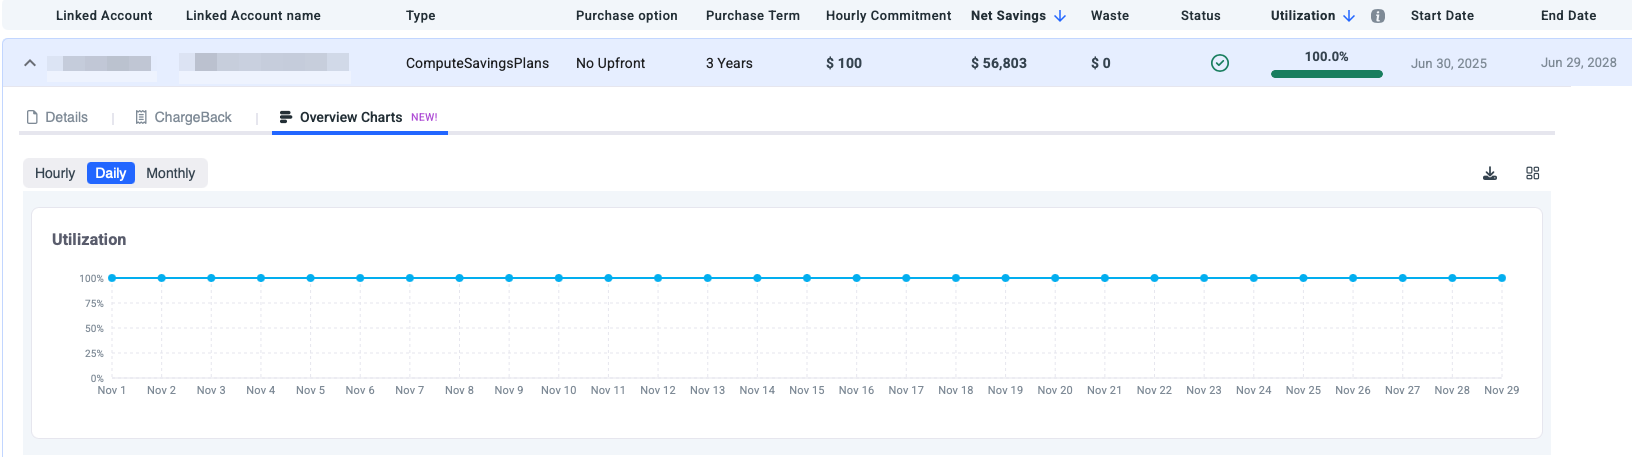
Overview Charts
This view shows the utilization for the selected Reserved Instance commitment.
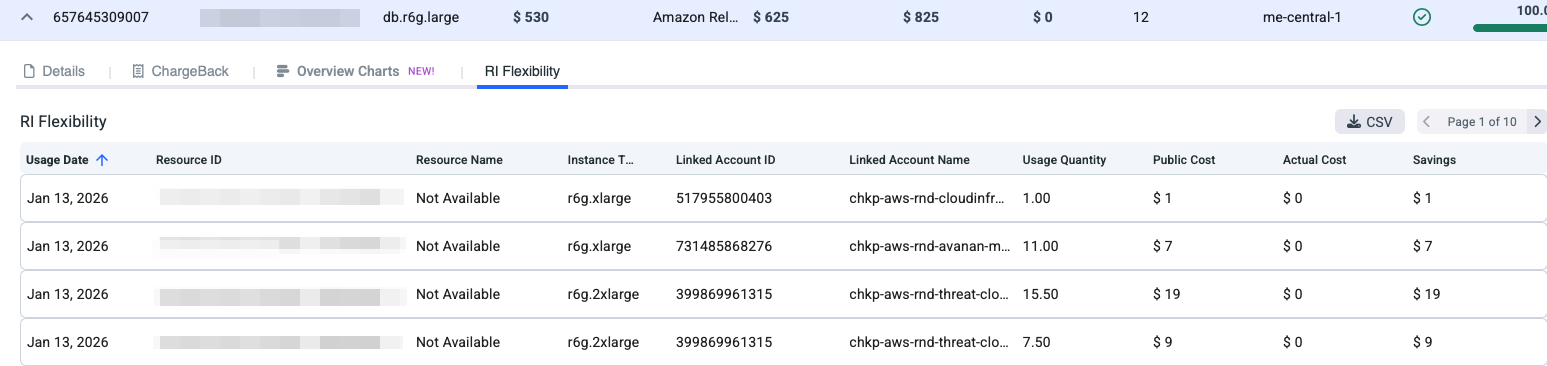
RI Flexibility
The list provides a breakdown of actual resource usage that consumed the Reserved Instance benefit, including:
- Usage date when the RI was applied.
- Resource ID and type (for example, EC2 or RDS instance types like r6g.xlarge).
- Linked account where the benefit was used
Whether the RI was applied to a different resource than originally purchased, which demonstrates size or resource-level flexibility
In short, this view helps you validate RI flexibility behavior, understand where the reservation discount is applied, and identify whether flexible RIs are being effectively utilized across eligible resources and accounts.