
Analytics - Summary
Overview
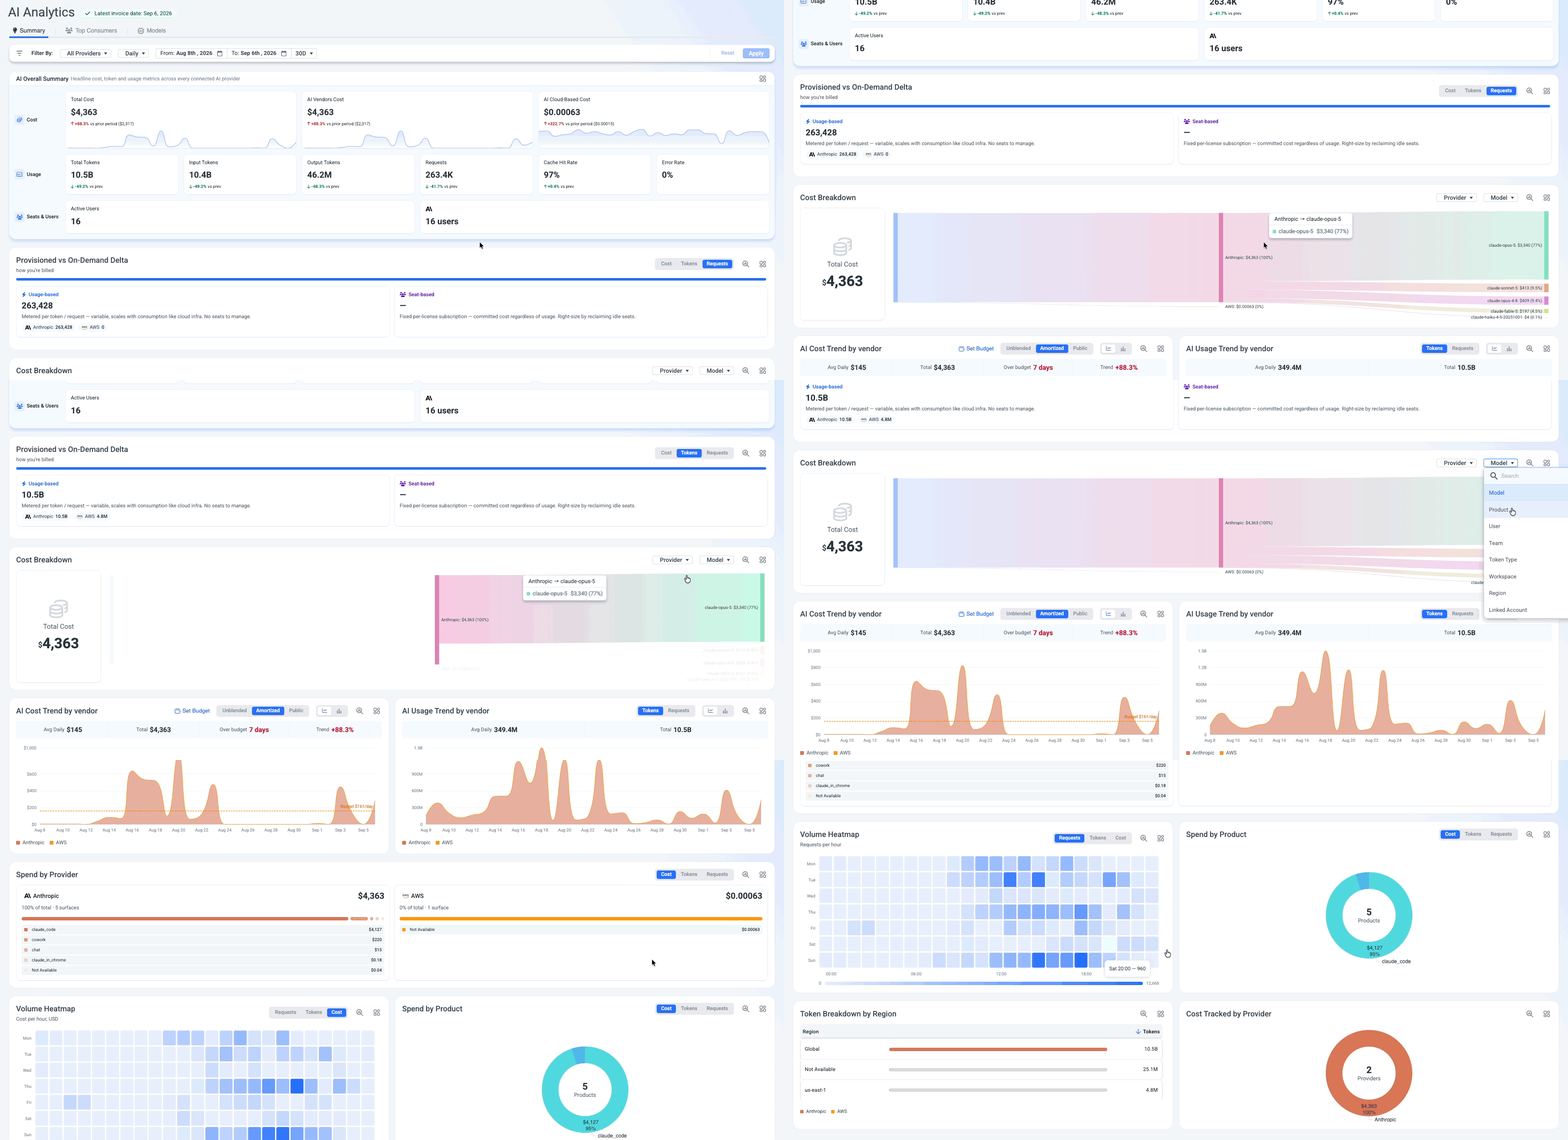
The AI Overall Summary is the top-level dashboard for AI spend visibility. It aggregates cost, token volume, seat utilization, and usage patterns across every connected AI provider into a single view - giving FinOps, engineering, and leadership a shared starting point before drilling into provider-specific details.
AI cost isn't one line item anymore. Organizations typically run a mix of usage-based API providers (Anthropic, OpenAI, Google, AWS Bedrock) and seat-based tools (GitHub Copilot, Cursor, Microsoft 365 Copilot) - each with its own billing console and cost model.
The Summary dashboard normalizes all of it into one place, splits cost by charge model so you know what's variable vs. committed, and surfaces seat utilization so you can reclaim idle licenses before the next renewal.
Supported providersAI Analytics currently supports Anthropic and AWS (Bedrock).
Soon to be added are: Cloud AI data originated from Azure and GCP, Cursor, Github and Open AI (Codex and ChatGPT).
AI Overall Summary
The AI Overall Summary is the first thing you see when you open the page - a set of KPI cards that answer the three questions every AI stakeholder asks: how much are we spending, how much are we consuming, and how many people are using it.
Cost tells you where the money is going. Total Cost is your all-in AI number across every connected provider. Below that, the split between AI Vendors Cost (what you pay AI providers directly - e.g. Anthropic API fees) and AI Cloud-Based Cost (the infrastructure layer running those models - e.g. AWS Bedrock compute) shows whether your spend is driven by the AI service itself or by the cloud resources behind it. Each card includes a sparkline and a percentage change vs the prior period so you can spot spending jumps before they compound.
Usage shows the volume behind that spend. Total Tokens, Input Tokens, and Output Tokens help you understand whether cost growth is coming from heavier prompts, longer completions, or both. Requests gives you the call volume, while Cache Hit Rate tells you how effectively your organization is reusing previous responses - a high cache rate means you're avoiding redundant computation. Error Rate flags reliability issues worth investigating.
Seats & Users closes the loop by showing how many people are actually consuming AI resources. Active Users counts the distinct users in the selected period, so you can track adoption trends and correlate headcount with spend.
Cost
| KPI | What it shows |
|---|---|
| Total Cost | Combined AI spend across all providers for the selected period. Includes a sparkline and percentage change vs the prior period. |
| AI Vendors Cost | Cost billed directly by AI vendors (e.g. Anthropic API usage fees). |
| AI Cloud-Based Cost | AI-related infrastructure cost from cloud providers (e.g. AWS Bedrock compute). |
Usage
| KPI | What it shows |
|---|---|
| Total Tokens | Aggregate token count (input + output) across all providers. |
| Input Tokens | Tokens sent to AI models (prompts, context). |
| Output Tokens | Tokens generated by AI models (completions, responses). |
| Requests | Total API requests across all providers. |
| Cache Hit Rate | Percentage of requests or tokens served from cache rather than recomputed. |
| Error Rate | Percentage of failed requests across all providers. |
Seats & Users
| KPI | What it shows |
|---|---|
| Active Users | Number of distinct users who consumed AI resources during the selected period. |
| Number of Seats per vendor | Number of payed seats per vendor |
Provisioned vs On-Demand Delta
This section splits your AI consumption into two billing models so you can see how much of your spend is variable (scales with usage) vs committed (fixed subscription).
| Billing model | Description |
|---|---|
| Usage-based | Metered per token or request - variable cost that scales with consumption, similar to cloud infrastructure. No seats to manage. |
| Seat-based | Fixed per-license subscription - committed cost regardless of actual usage. Optimize by reclaiming idle seats. |
Use the Cost, Tokens, and Requests toggles in the top-right corner to switch the unit shown in each card.
When viewing Requests, the Usage-based card shows the request count broken down by provider (e.g. Anthropic 263,428 / AWS 0). A blue progress bar at the top of the section visualizes the ratio between usage-based and seat-based consumption.
Why this mattersUnderstanding your billing-model mix helps you decide whether to negotiate committed-use discounts with vendors or stay on pay-as-you-go. If most spend is usage-based, you have room to optimize through caching, prompt compression, or model selection. If it's seat-based, focus on reclaiming unused licenses.
AI Cost Trend by vendor
This chart tracks your AI spend over time, broken down by provider, so you can see whether cost growth is steady or spiky - and which vendor is driving it. A dashed budget line makes overruns immediately visible.
The headline stats across the top summarize the selected period at a glance: Avg Daily cost, Total spend, Over budget day count, and overall Trend percentage.
Use the toggles above the chart to control the view:
| Toggle | Options |
|---|---|
| Cost type | Unblended, Amortized, Public |
| Chart style | Area, bar, stacked bar |
| Budget | Click Set Budget to define a daily budget threshold. Once set, the chart shows a dashed line and the "Over budget" stat counts how many days exceeded it. |
AI Usage Trend by vendor
The companion to the cost chart - same time axis, but measured in Tokens or Requests (toggle in the top-right). Headline stats show Avg Daily volume and Total for the period.
Comparing the cost and usage trends side by side reveals rate changes: if cost is rising faster than token volume, your model mix may be shifting toward more expensive models.
Volume Heatmap
A day-of-week × hour-of-day heatmap that shows when AI consumption peaks. Toggle between Requests, Tokens, and Cost to see different activity patterns. The color scale runs from zero (white) to the peak value in the period.
Use this to spot patterns - heavy weekday afternoon usage might indicate batch jobs or a specific team's workflow, while off-hours spikes could flag automated pipelines worth investigating for cost efficiency.
Updated 13 days ago