
K8s Unified FAQ
How to see the allocation of each cluster/node/pods/etc
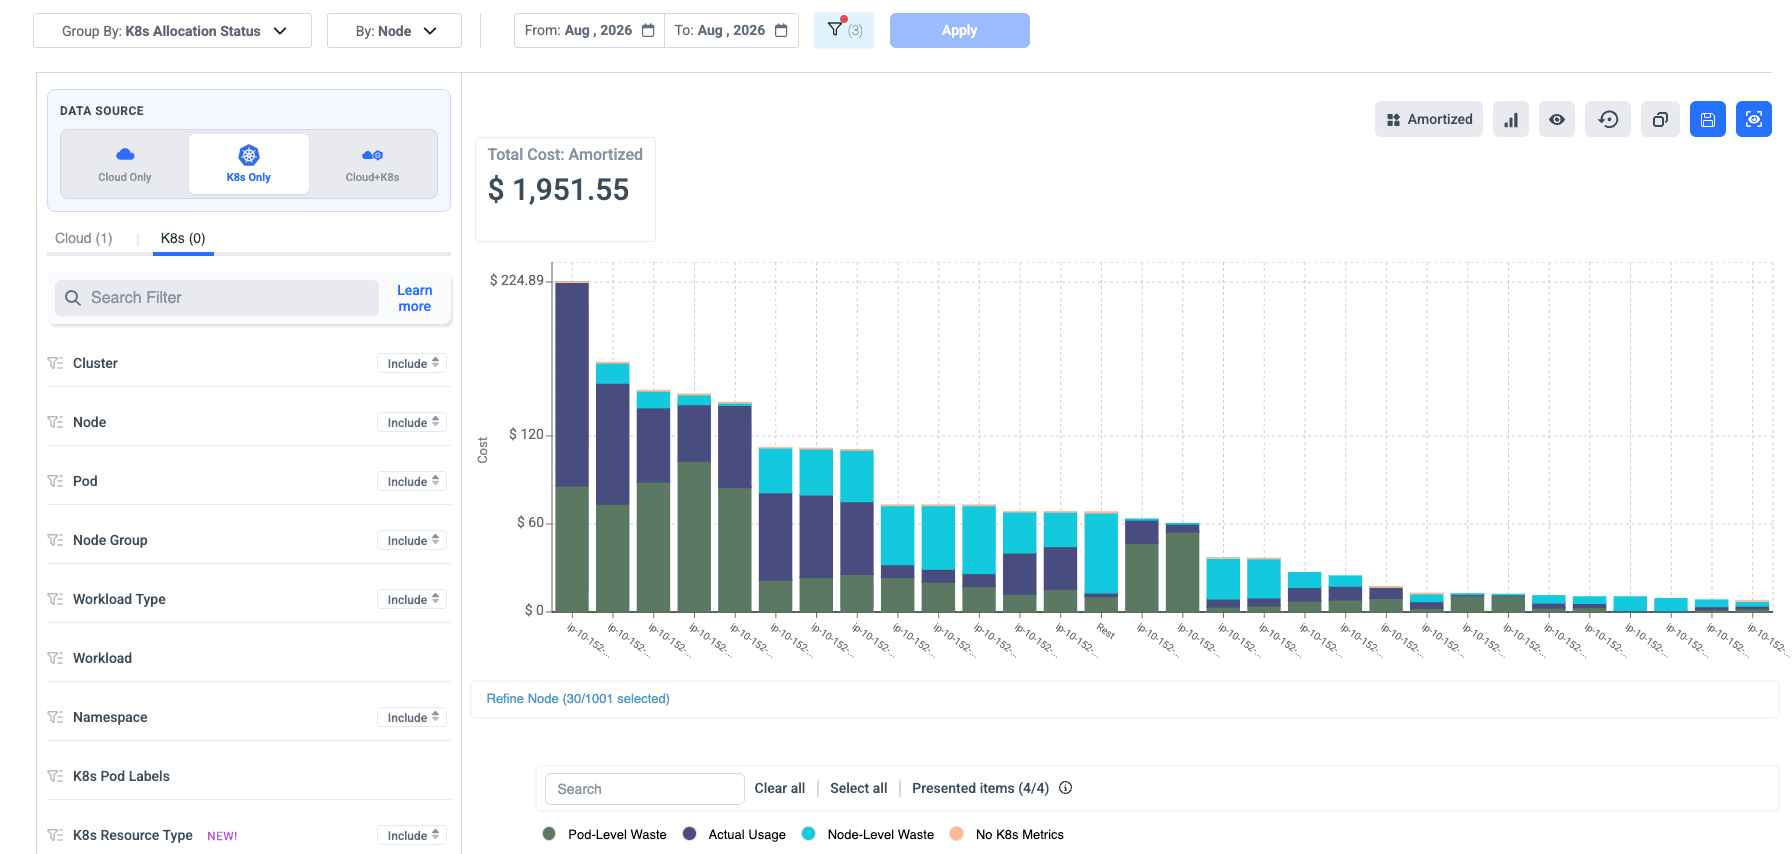
In the first grouping, select “K8s Allocation Status.” In the secondary grouping, select any field you’d like (e.g., Node).
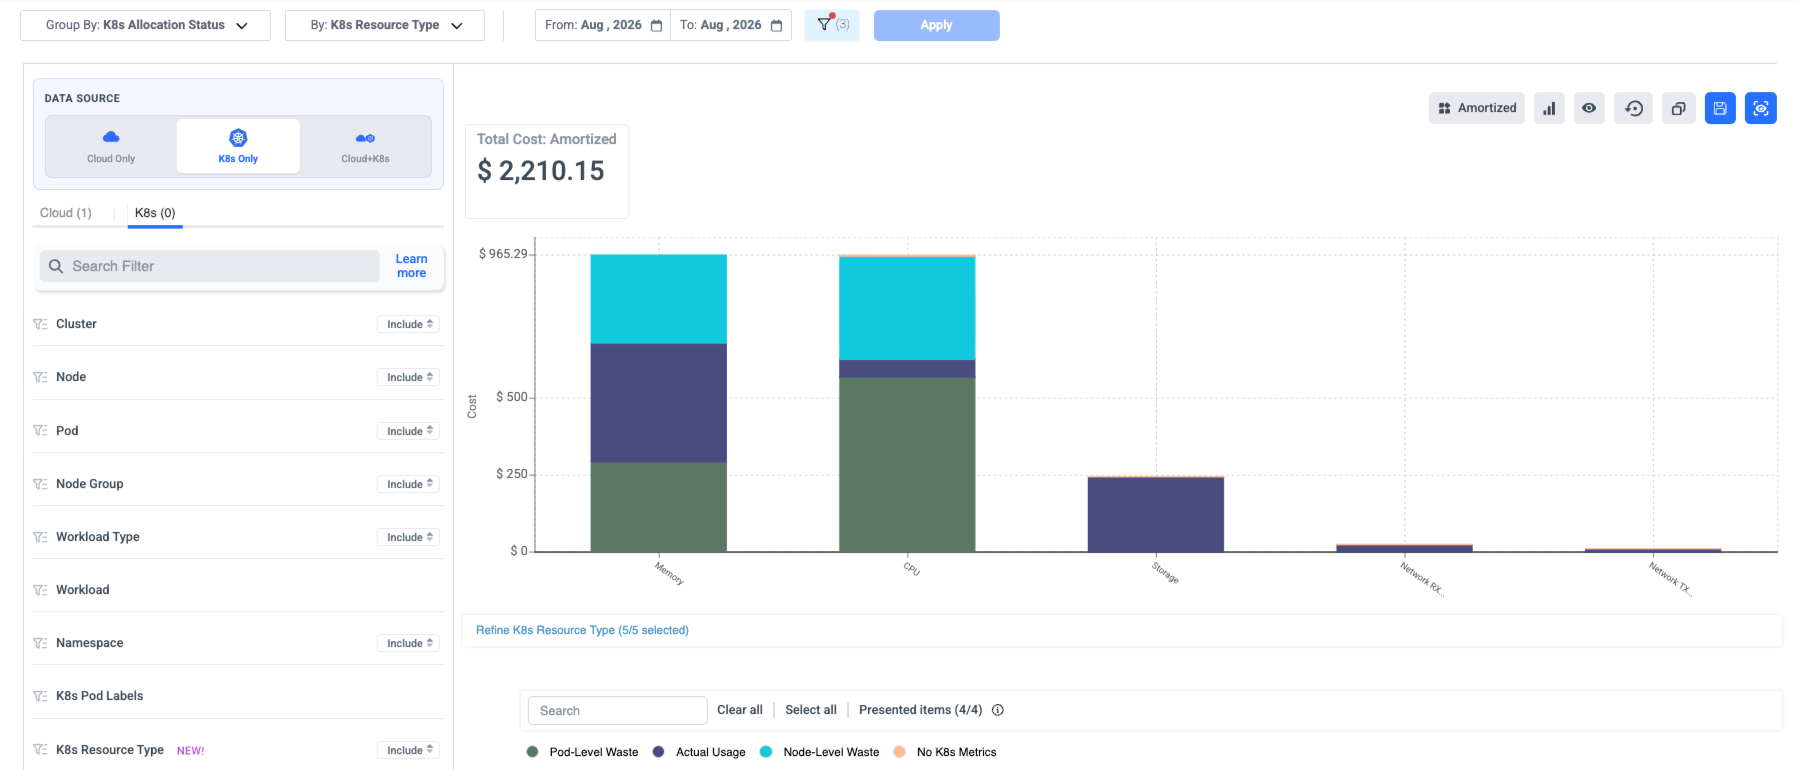
You’ll then be able to see, for each node, the pod-level waste, node-level waste, actual usage, or no K8s metrics- meaning we didn’t receive metrics for that period, but metrics were received previously.
How to see which portion of my cost is being wasted?
Utilize the new field "K8s Allocation Status" in the filter/grouping, which will allow you to see which portion of your cost is being used and which is pod-level waste or node-level waste.
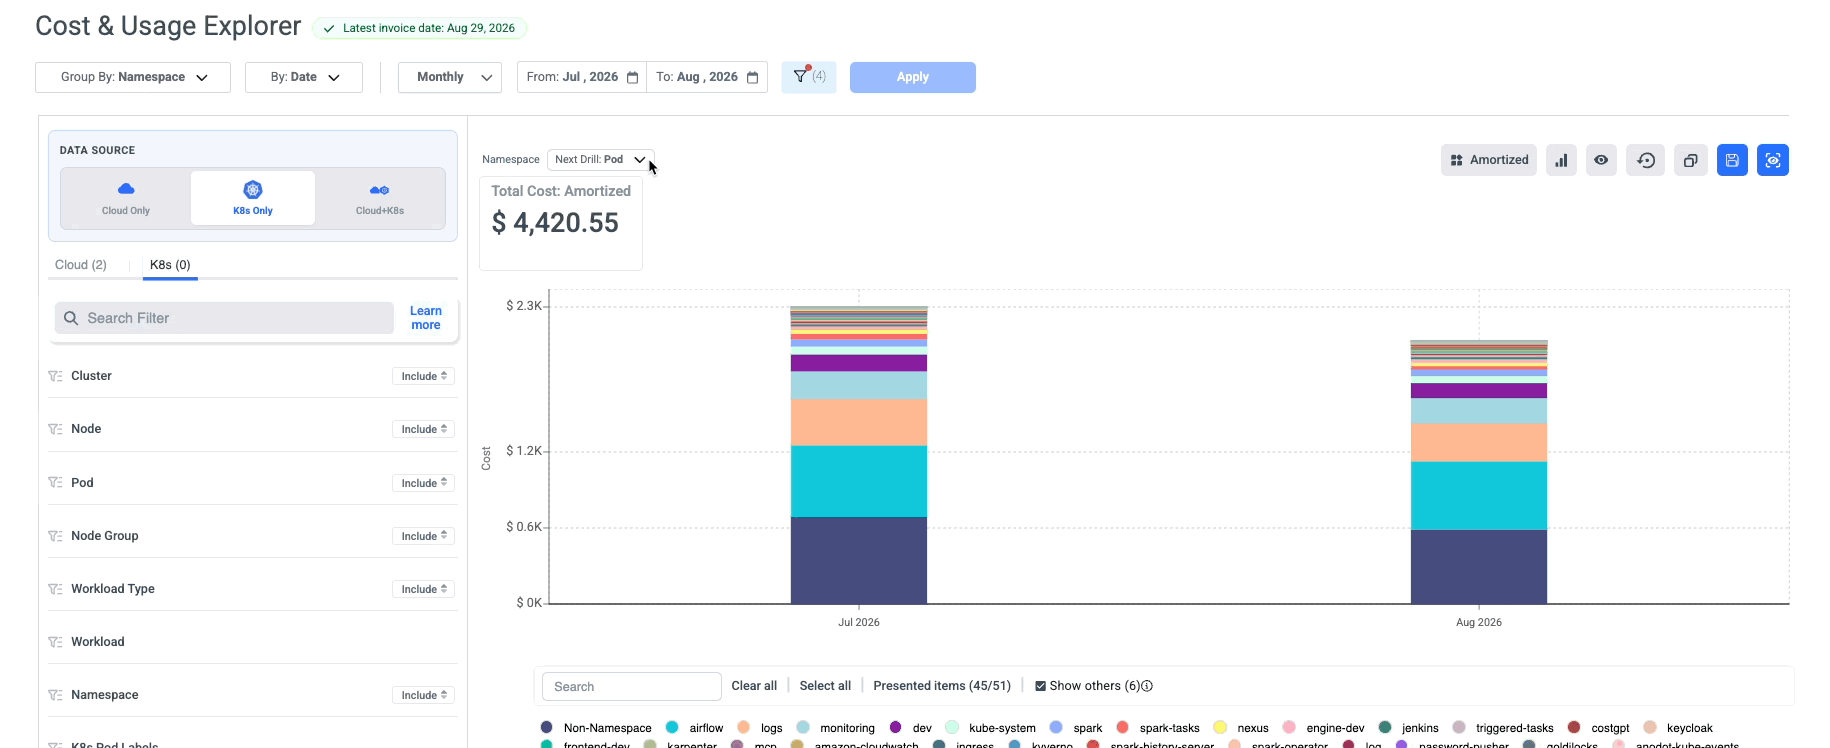
For example, in order to see namespace waste, when grouping by Namespace, click the non-namespace, while choosing the next drill "K8s Allocation Status" to see the node-level waste.
Note: you can also click on each namespace in order to see the usage and pod-level waste portion.
How to see the number of pods/ nodes/ namespace in a specific time?
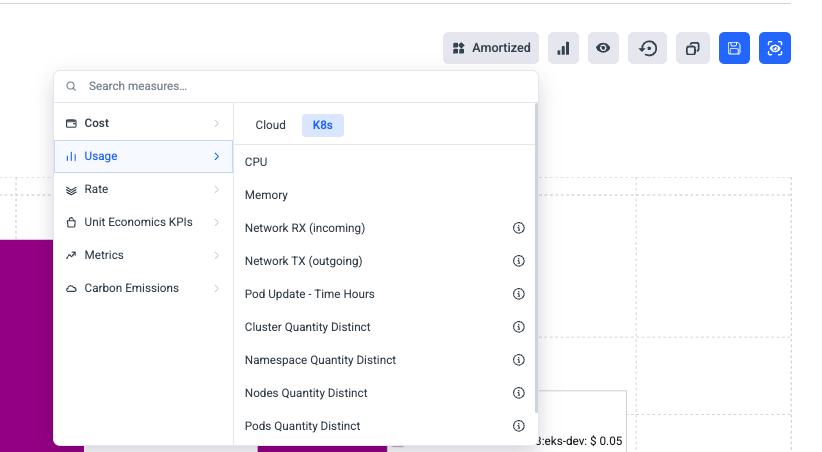
Click on the measurement option, and choose the K8s Usage types:
How to see the commitment coverage of my K8s cost
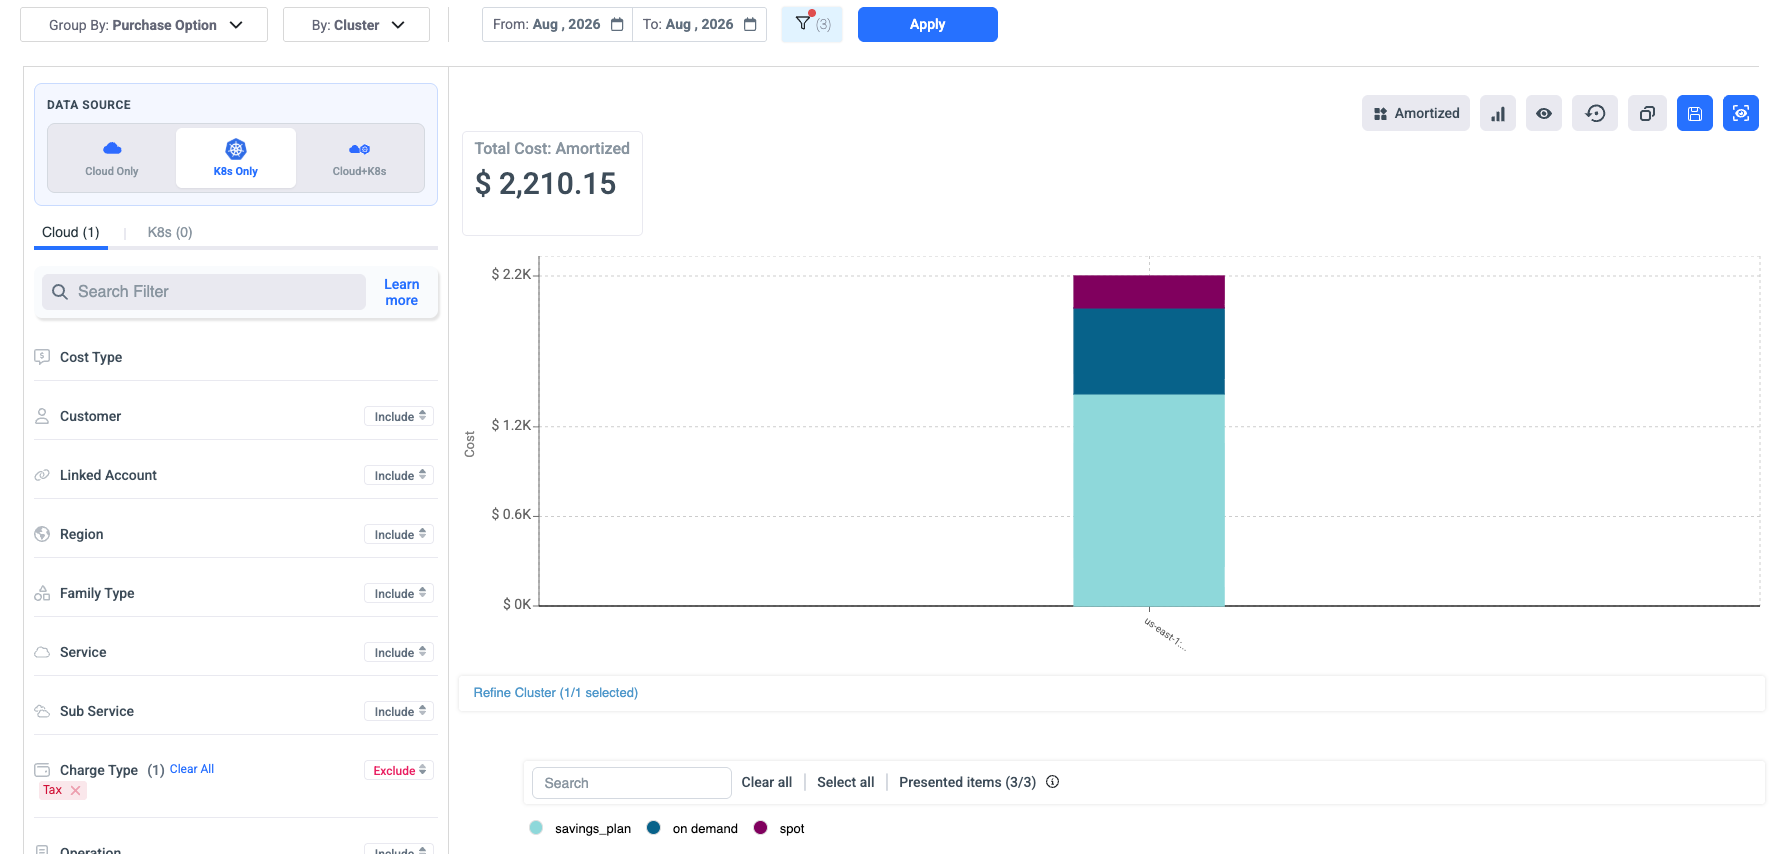
From the filters, select K8s only as the data source, then group by Purchase Option under the Cloud tab.
This will show the classification across Commitments, On-Demand, and Spot usage.
You can also filter or group by a specific K8s dimension to see coverage for a specific namespace, node, etc.
Updated about 2 months ago