
Analytics - Models
Overview
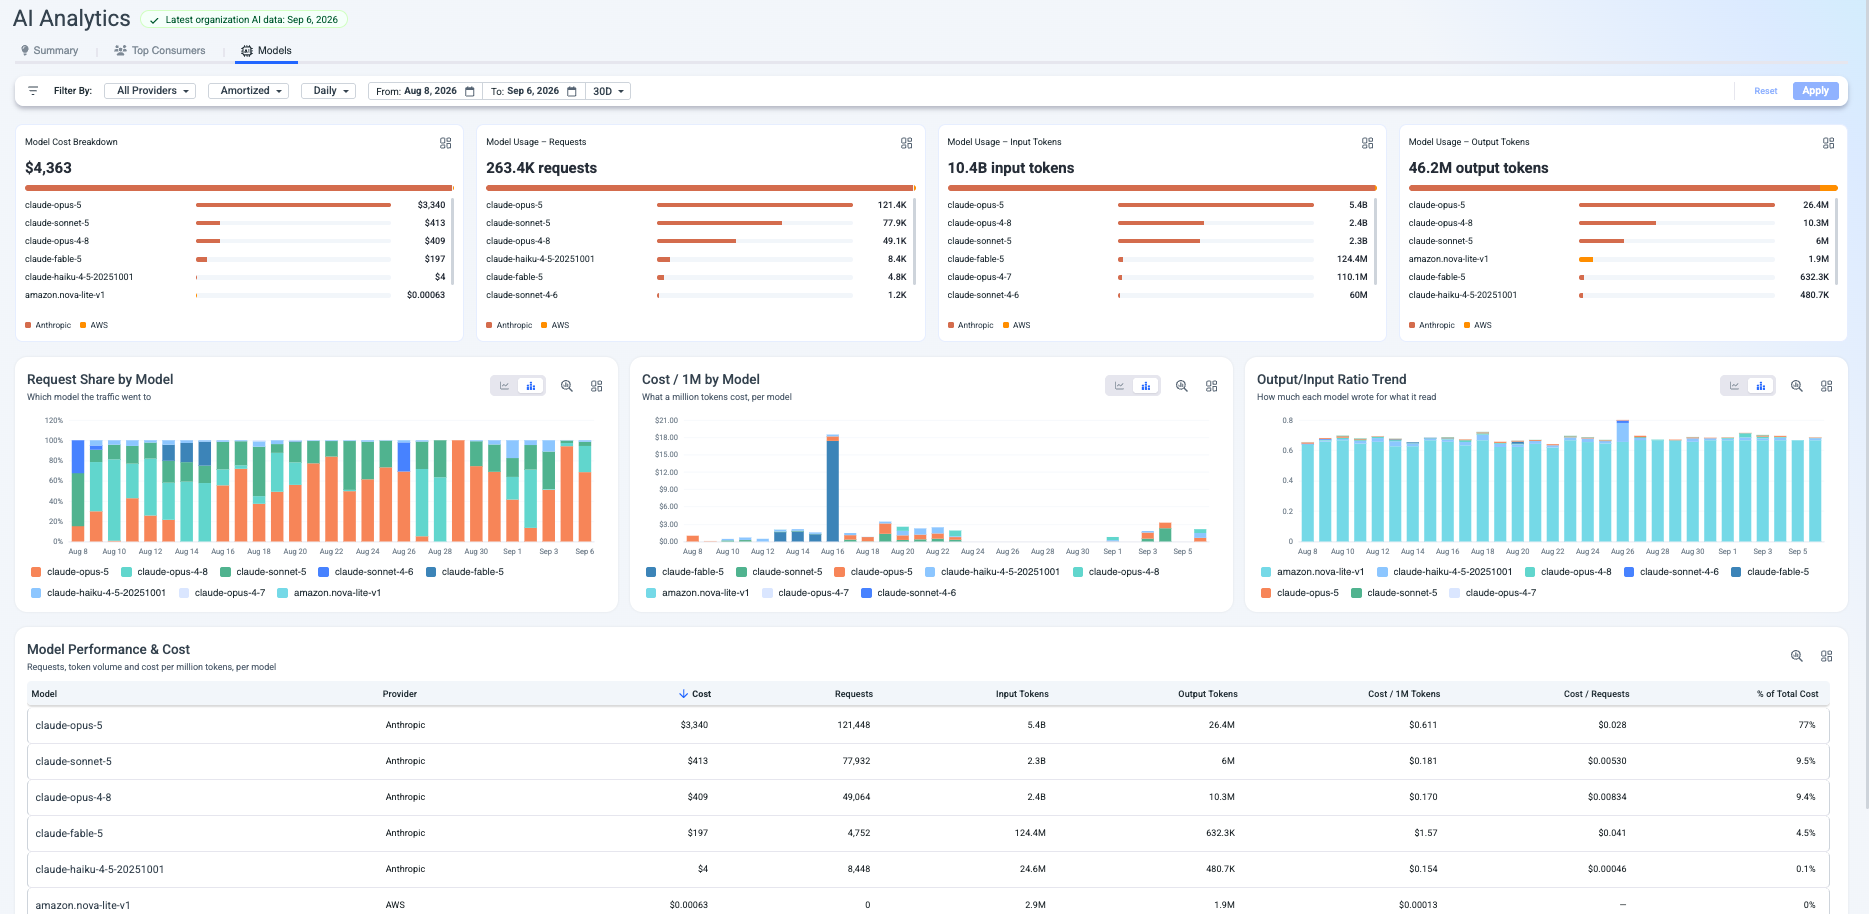
The Models tab gives you a model-by-model view of where your AI budget goes and how efficiently each model performs. Use it to answer questions like: is our most expensive model also our most used? Are we paying a premium for capability we don't need? Which model gives us the best cost per million tokens?
Filters
The Models tab shares the global filter bar with the other tabs, plus an additional cost-type selector.
| Filter | What it does |
|---|---|
| Filter By | Narrow to a specific AI provider. Defaults to All Providers. |
| Cost type | Switch between Unblended, Amortized, and Public cost views. |
| Granularity | Time grain for time-series charts. Defaults to Daily. |
| From / To | Date range. |
| Period preset | Quick-select (e.g. 30D). |
Reading the Models tab
The tab is organized in three layers: summary cards at the top, trend charts in the middle, and a detailed comparison table at the bottom.
Model summary cards
Four cards across the top give you the headline breakdown:
- Model Cost Breakdown shows total spend split by model, with provider color-coding (e.g. Anthropic vs AWS). This is your quick answer to "which model is costing us the most?"
- Model Usage - Requests ranks models by API call volume. A model with high request count but low cost may be handling lightweight tasks efficiently. A model with low requests but high cost is worth investigating - it might be the right tool for complex tasks, or it might be over-provisioned.
- Model Usage - Input Tokens ranks by the volume of tokens sent to each model (prompts, context, documents). Models consuming large input volumes are likely handling long-context tasks like document analysis or code review.
- Model Usage - Output Tokens ranks by tokens generated. Models with high output relative to input are producing long completions - useful for generation-heavy workflows, but potentially wasteful if the output isn't fully consumed.
Trend charts
Three time-series charts show how model usage patterns evolve over the selected period. Each chart offers line and bar toggle options.
- Request Share by Model is a 100% stacked chart showing which model the traffic went to each day. Use it to spot model migration patterns - if a new model is gradually taking share from an older one, you'll see the shift here.
- Cost / 1M by Model shows what a million tokens costs per model per day. This is your unit economics view. Spikes might indicate a pricing change, a shift in prompt complexity, or a model version update.
- Output/Input Ratio Trend shows how much each model wrote relative to what it read. A ratio of 0.5 means the model generated roughly half as many tokens as it consumed. Models with consistently low ratios are doing more reading than writing (e.g. classification, extraction), while higher ratios suggest generation-heavy work (e.g. drafting, code creation).
Model Performance & Cost table
The detail table at the bottom brings everything together in one sortable view. Each row is a model, with columns covering the full cost-efficiency picture:
| Column | What it tells you |
|---|---|
| Model | The model identifier (e.g. claude-opus-5, amazon.nova-lite-v1). |
| Provider | The AI vendor (Anthropic, AWS). |
| Cost | Total spend for this model in the selected period. |
| Requests | Total API calls to this model. |
| Input Tokens | Total tokens sent to the model. |
| Output Tokens | Total tokens generated by the model. |
| Cost / 1M Tokens | Unit cost - what you pay per million tokens. The key efficiency metric for comparing models. |
| Cost / Requests | Average cost per API call. Useful for budgeting per-interaction costs. |
| % of Total Cost | This model's share of your total AI spend. |
How to use this tableSort by Cost / 1M Tokens to find your most and least cost-efficient models. Then cross-reference with Requests and % of Total Cost to focus optimization on the models that actually move the needle. A model with high unit cost but 0.1% of total spend isn't worth optimizing before a cheaper model that carries 77% of the bill.
Updated about 2 months ago