
Analytics - Top Consumers
Overview
The Top Consumers tab answers the question every FinOps lead and engineering manager asks when the AI bill goes up: who's spending, on what, and where?
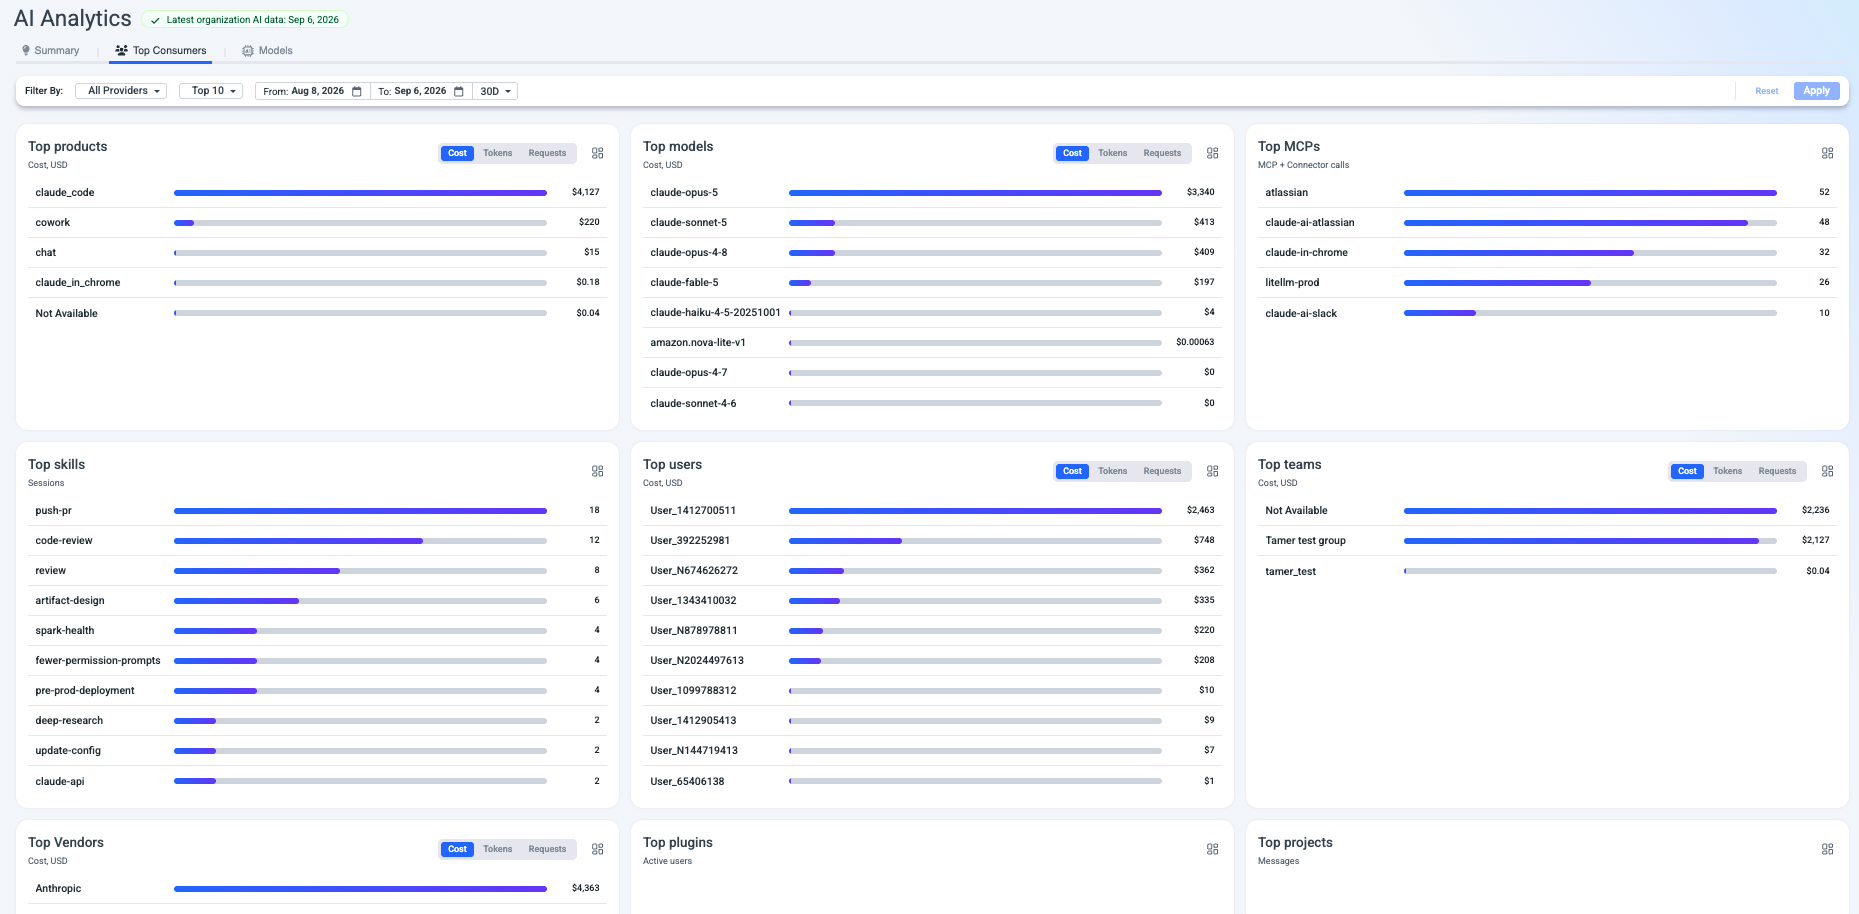
Instead of a single leaderboard, this tab breaks consumption into ten ranked lists - each showing a different dimension of your AI usage. Every list highlights the top contributors so you can quickly pinpoint where optimization efforts will have the biggest impact.
How the rankings work
All rankings respect the shared filter bar at the top of the page:
| Filter | What it does |
|---|---|
| Filter By | Narrow to a specific AI provider. Defaults to All Providers. |
| Top N | Controls how many entries each card shows. Defaults to Top 10 |
| From / To | Date range. |
| Period preset | Quick-select (e.g. 30D). |
Most cards offer Cost, Tokens, and Requests toggles so you can view the same ranking in different units. Cards without these toggles use a fixed metric noted in their subtitle.
Top products
Ranks the AI products (client applications) driving your spend. This tells you which tools in your AI stack are consuming the most resources - for example, whether coding agents or chat interfaces dominate your bill.
Products visible in the screenshot include claude_code, cowork, chat, and claude_in_chrome.
Top models
Ranks the specific AI models by cost, token volume, or request count. This is where you see whether your spend is concentrated on a premium model or spread across a range - critical for deciding whether to set model-routing policies or negotiate volume pricing.
Models span multiple providers and generations (e.g. claude-opus-5, claude-sonnet-5, amazon.nova-lite-v1), giving you a cross-provider view in one list.
Top MCPs
Ranks MCP (Model Context Protocol) connectors and integrations by call count. The subtitle reads "MCP + Connector calls," so each entry reflects how many times that connector was invoked during the period.
This helps you understand which external integrations are most active. High call counts on a connector might indicate heavy workflow automation, or might signal an integration making redundant calls worth optimizing.
Top skills
Ranks AI skills by session count. Skills are reusable instruction sets that guide how Claude handles specific types of work (e.g. push-pr, code-review, artifact-design).
This view shows which skills your team relies on most, helping you prioritize skill maintenance and identify candidates for optimization.
Top users
Ranks individual users by AI consumption. Users may appear as hashed identifiers (e.g. User_1412700511) or by name, depending on your identity configuration.
Toggle between Cost, Tokens, and Requests to understand whether a user's high spend comes from volume (many requests) or intensity (large prompts, expensive models).
Top teams
Ranks teams by AI consumption. This is your chargeback and showback view - see which teams are driving the AI bill and whether spend aligns with their expected usage patterns.
Top Vendors
Ranks AI vendors (providers) by spend. In a multi-provider environment, this shows the cost split at the vendor level - for example, Anthropic vs AWS.
Top plugins
Ranks plugins by active user count.
Top projects
Ranks projects by message count.
Top artifacts
Ranks artifact types by generated count. Artifacts are the files and outputs Claude creates during conversations - documents, code files, HTML pages, and other deliverables. This shows which output types your team generates most.
Updated about 2 months ago