My Commitments-Savings Plans
Overview
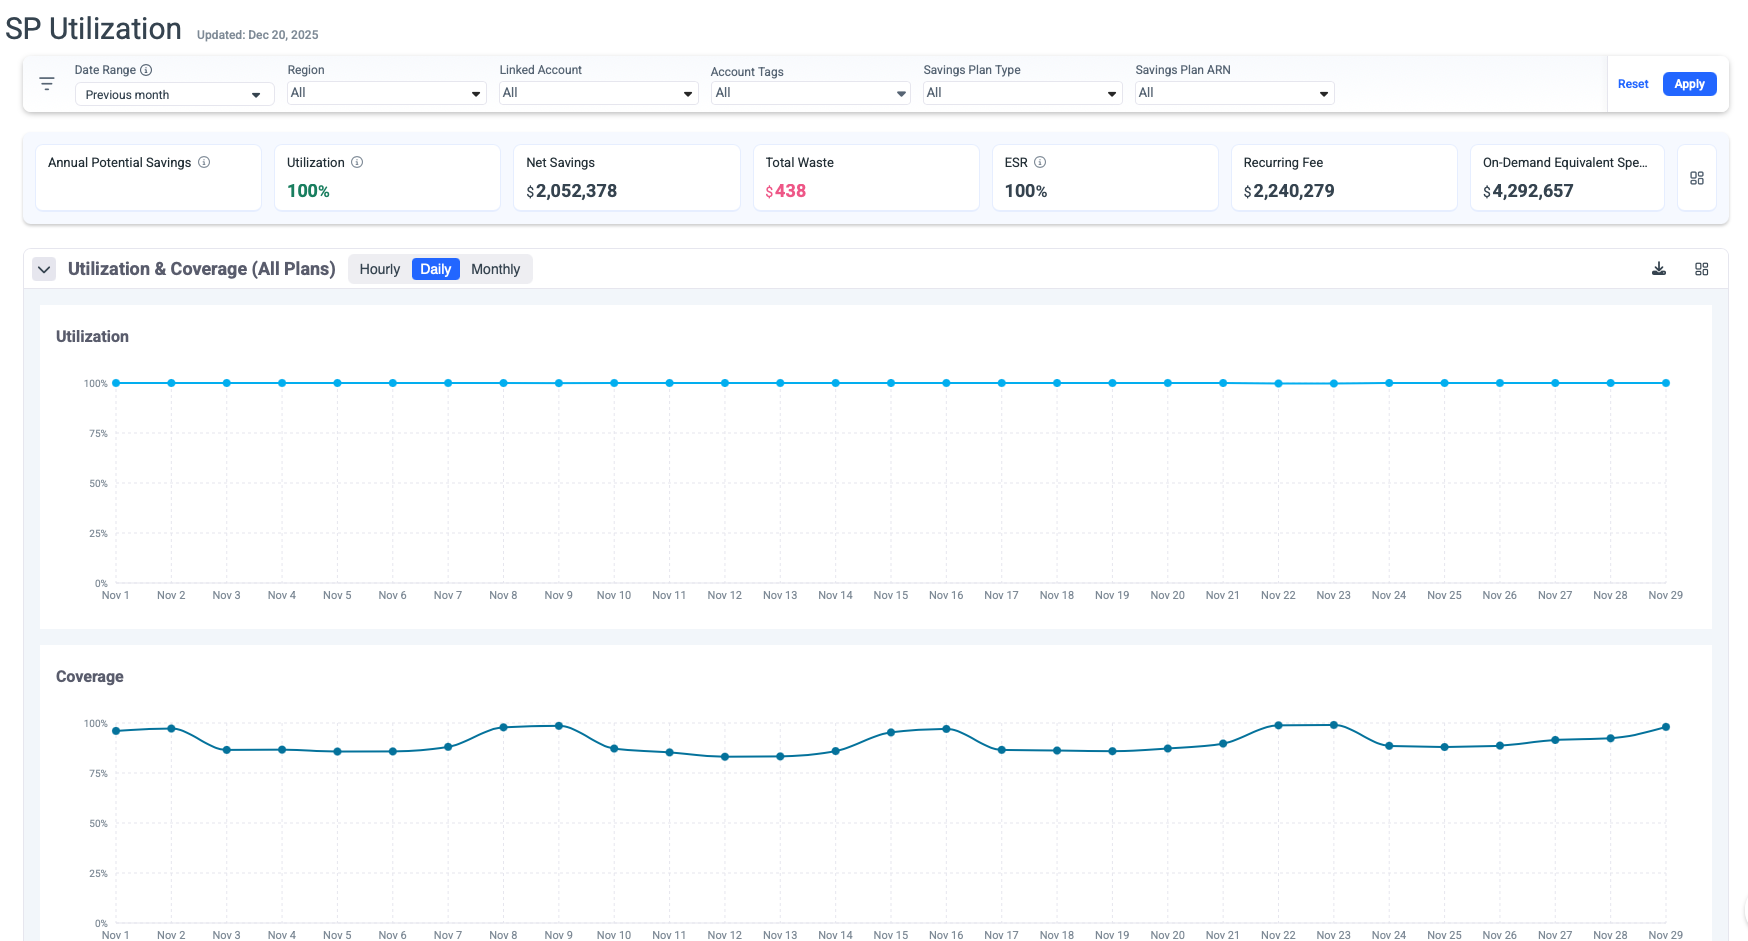
The Savings Plan Utilization page provides comprehensive monitoring and analysis of your AWS Savings Plans performance, status, and inventory. This dashboard enables you to track utilization/coverage rates, identify optimization opportunities, and maximize cost savings across your AWS infrastructure.
Key Capabilities
Real-Time Performance Monitoring
- Track utilization and coverage metrics across all active Savings Plans.
- Monitor net savings and waste in real-time.
- View Effective Savings Rate (ESR) to measure overall performance.
- Compare on-demand equivalent costs against actual spending.
All KPI values dynamically reflect the selected date range and any additional filters applied in the view.
Multi-Dimensional Filtering
Access granular views of your Savings Plans through customizable filters:
- Date Range: Analyze historical trends or focus on specific periods.
- Region: Filter by AWS region to understand geographic cost distribution.
- Linked Account: View utilization across organizational accounts.
- Account Tags: Group and analyze by custom tagging strategies.
- Savings Plan Type: Filter by Compute, EC2 Instance, DataBases or SageMaker plans.
- Savings Plan ARN: Drill down to individual plan performance.
- Customer: The filter is also available for MSPs.

Dashboard Metrics

Tips
- The metrics correspond to the selected filters.
- The metrics panel can be saved as dashboard panels.
-
Annual Potential Savings: Represent the annual savings derived from the Savings Plan recommendation if it exists in the waste detector for the chosen set of filters.
-
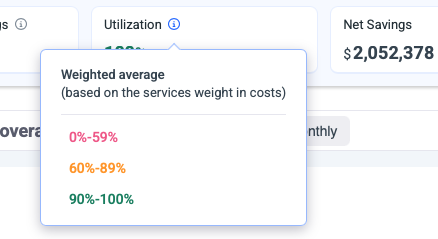
Utilization: Utilization weighted average, based on the metrics utilization consumed from AWS.
-
Net Savings:Total actual savings realized from your Savings Plans
-
Total Waste: Unused commitment costs (indicates underutilization)
-
ESR: Effective Savings Rate (ESR) measures the actual percentage saved compared to On-Demand pricing across all your Savings Plans.
-
Recurring Fee: Total ongoing commitment costs across all plans.
-
On-Demand Equivalent: What these resources would cost at on-demand rates.
Performance Graphs
Utilization Graph
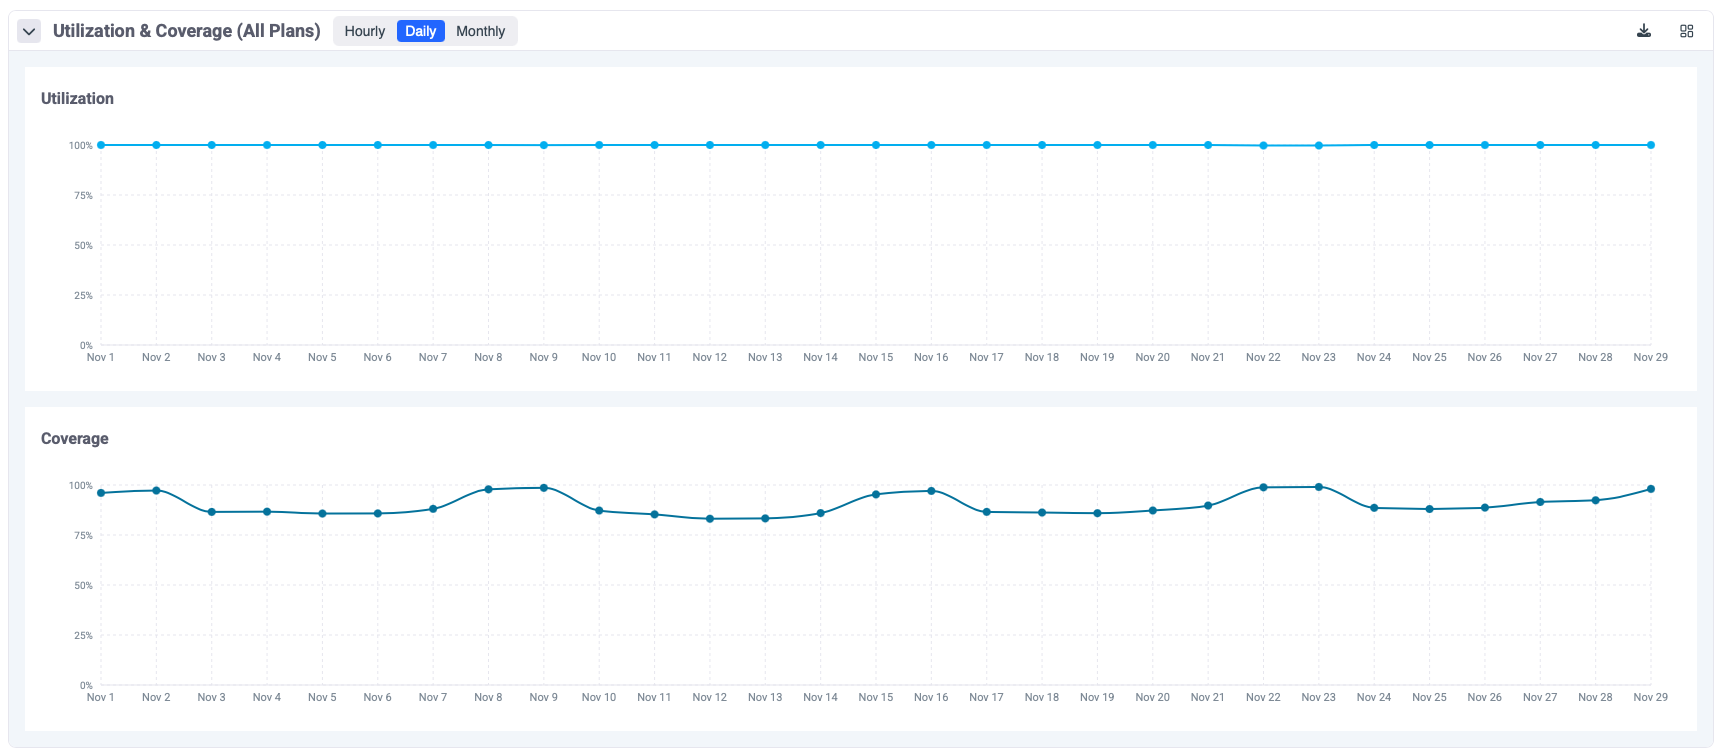
The utilization graph displays daily/hourly utilization percentage over time. and helps identify usage patterns and trends. Supports hourly, daily, and monthly views.
- Umbrella is using AWS GET SP Utilization API to retrieve the utilization data per all plans combined and per the plan.
Required permissions ce:GetSavingsPlansUtilization.
Coverage Graph
The coverage graph tracks coverage stability over time and shows the percentage of eligible usage covered by Savings Plans.
- Umbrella is using AWS GET SP Coverage API to retrieve the utilization data per all plans combined and per the plan.
Required permissions ce:GetSavingsPlansCoverage.
Tips
The graphs can be saved as dashboard panels
Savings Plans Table
- The table can be filtered by Active, Expired this month, and Expired.
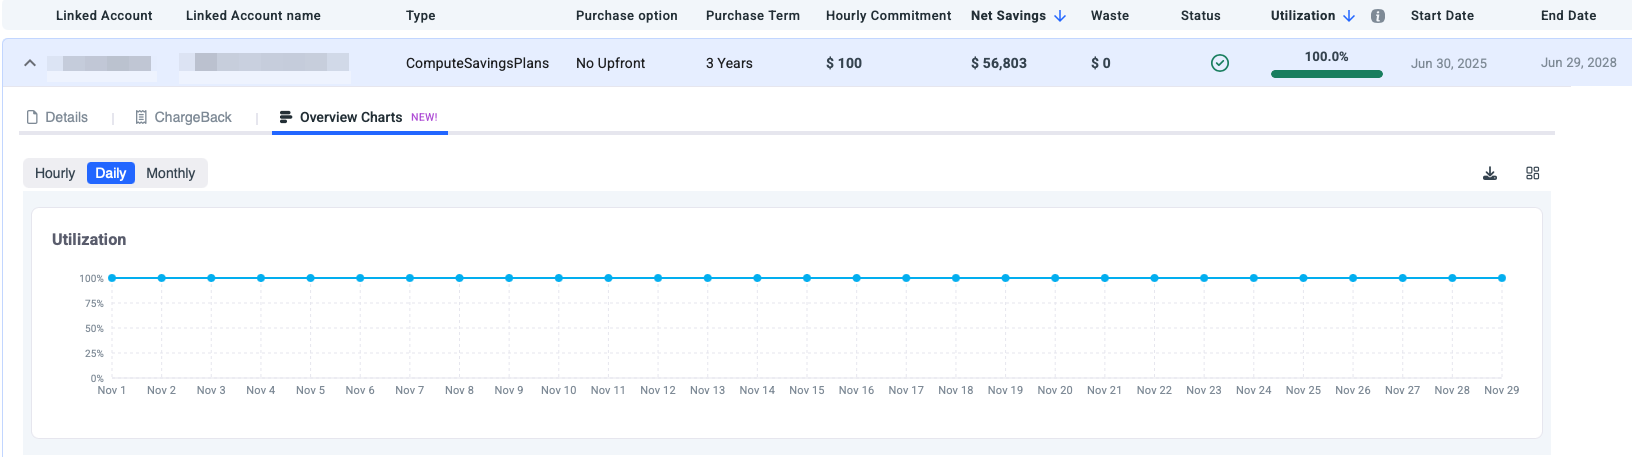
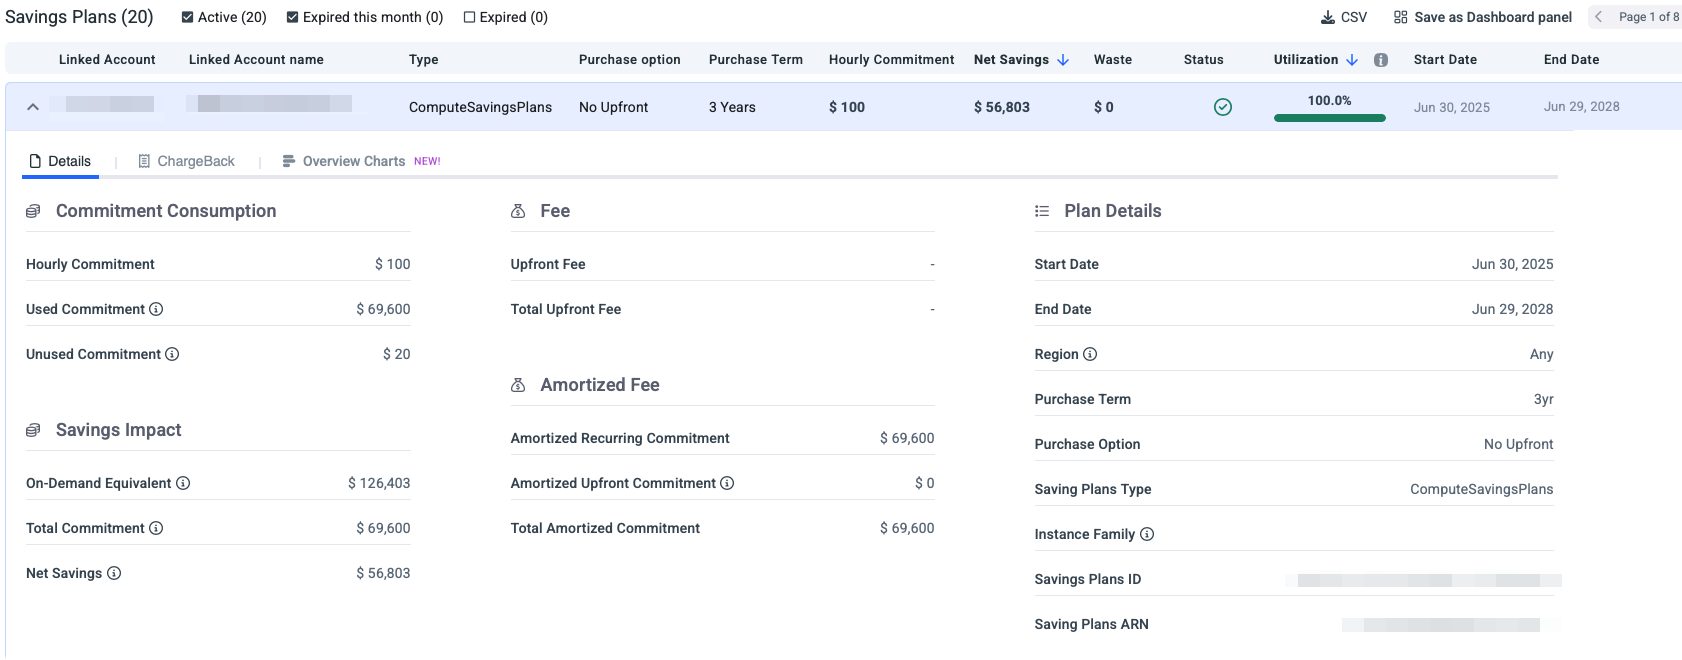
- Click on any Savings Plan row to expand detailed information:
- Details: Full commitment details.
- Chargeback: List of resources consuming this Savings Plan commitment.
- Overview Charges: Utilization breakdown for this Savings Plan commitment.
Detailed Plan View
Click on any Savings Plan row to expand detailed information:
- Details: Full commitment details.
- Chargeback: List of resources consuming this Savings Plan commitment.
- Overview Charges: Utilization breakdown for this Savings Plan commitment.
- The detailed table view provides plan-level insights:
-
Linked Account Name: AWS account associated with the plan.
-
Type: Plan type (ComputeSavingsPlans, EC2InstanceSavingsPlans, SageMakerSavingsPlans).
-
Purchase Option: Payment structure (No Upfront, Partial Upfront, All Upfront).
-
Purchase Term: Commitment duration (1 Year or 3 Years).
-
Hourly Commitment: Dollar amount committed per hour.
-
Net Savings: Actual savings generated by this plan.
-
Waste: Unused commitment costs.
-
Status: Plan health indicator (Active, Expired).
-
Utilization: Current utilization percentage with visual indicator
🟢 Green checkmark: Healthy utilization (typically >90%) 🟡 Yellow warning: Moderate utilization concerns 🔴 Red alert: Significant underutilization
-
Start Date: When the plan became active.
-
End Date: Plan expiration date.
-
All KPI values dynamically reflect the selected date range and any additional filters applied in the view.
ChargeBack
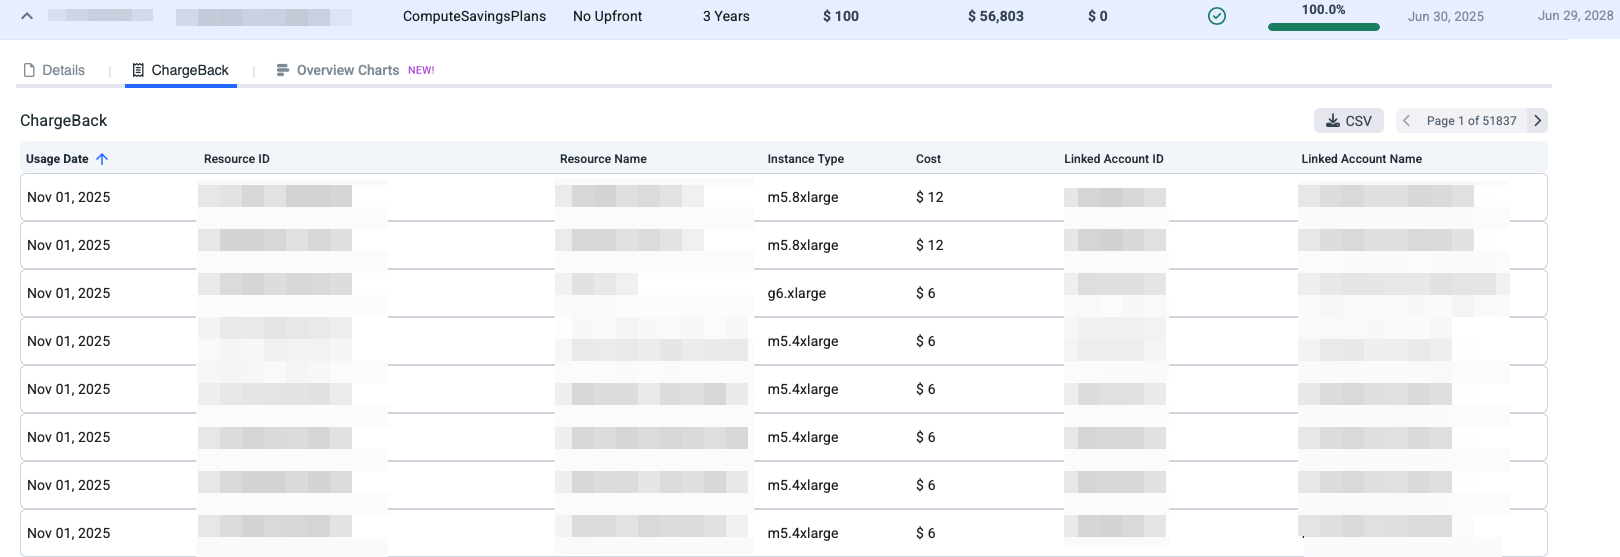
The Chargeback view shows how a Savings Plan commitment is consumed across your AWS resources. Each resource is charged based on its actual usage that benefited from the Savings Plan.
With the Chargeback view, you can:
- See which resources consumed the Savings Plan.
- Understand how much of the commitment was applied to each resource.
- Accurately allocate discounted costs for chargeback or showback purposes.
Overview Charts
This view shows the utilization for the selected Savings Plan commitment.