
Tokenomics
Overview
The Tokenomics dashboard turns raw AI cost and usage data into unit economics - cost per request, cost per token, cache hit rates, and output-to-input ratios - so you can answer "is our AI spend efficient?" without building your own metrics layer.
Knowing your total AI spend is step one. Knowing whether that spend is efficient is what drives optimization decisions. A $50K monthly bill means something very different at $0.02 per request than at $0.08. The Tokenomics dashboard surfaces these ratios automatically, broken down by model, provider, and use case, so you can spot which models are overpriced for their workload and where caching is - or isn't - paying off.
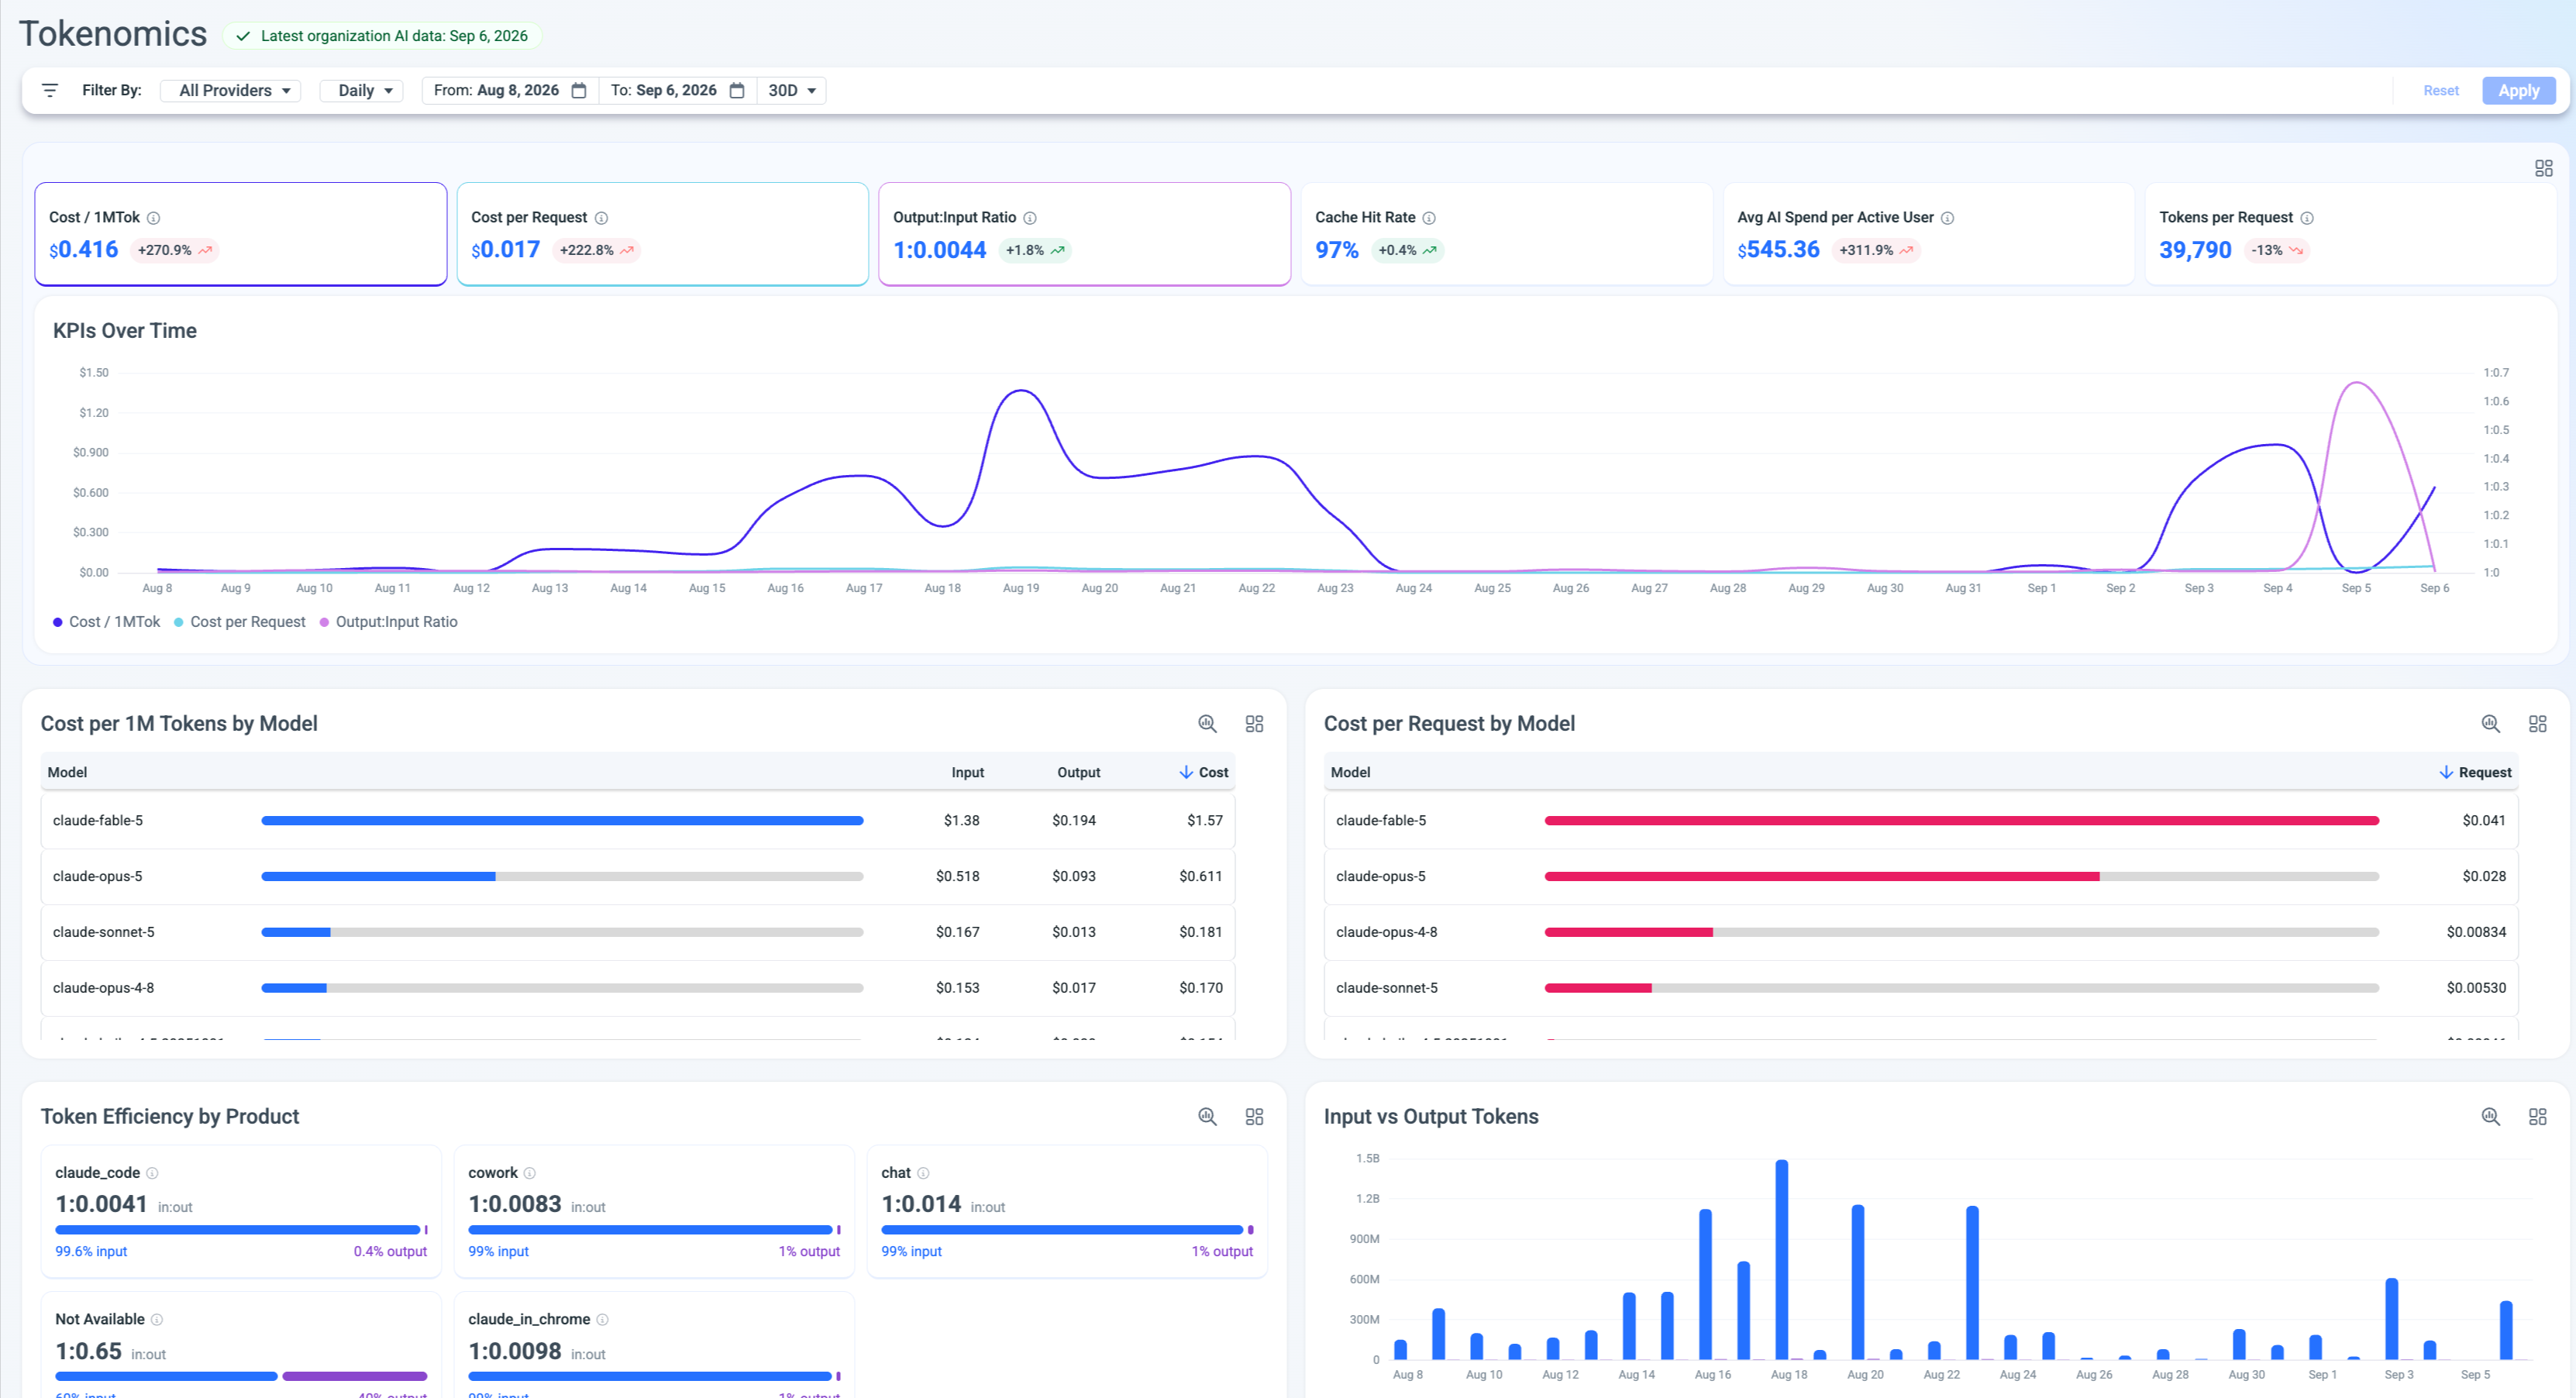
Dashboard layout
The page is organized top to bottom: filters and controls, KPI summary cards, a trend chart, and detail panels.
Filters and controls
| Control | What it does |
|---|---|
| Provider | Scope to one or more AI providers (top filter bar). Default: All AI providers. |
| Agent | Filter by agent. Default: All Agents. |
| Model | Narrow to specific models. |
| Workspace | Scope to a team or business unit. |
| Cost | Select the cost basis - e.g. Amortized. Same options as the AI Cost & Usage Explorer. |
| Granularity | Toggle between Hourly, 1M (one month, default), and 3M (three months). |
KPI summary cards
The top of the dashboard shows KPI cards - each displaying a metric value, a period-over-period trend (e.g. -4.2%), the underlying formula, and colored badges indicating which providers contribute data.
Cost efficiency KPIs:
| KPI | Formula | What it tells you |
|---|---|---|
| Blended Cost / 1M Tokens | total_cost / ((input + output) / 1,000,000) | Your all-in cost per million tokens across all models. The single best summary metric for AI unit cost. |
| Cost per Request | total_cost / request_count | Average cost of a single API call. Use this to compare models and set per-team budgets. |
| Cost per Message | total_cost / message_count | Cost per end-user message, useful for consumer-facing products. |
| Cost per Conversation | total_cost / conversation_count | Cost for a full conversation session - relevant for chat and agent workloads. |
| Cost per Artifact | total_cost / artifact_count | Cost to produce a single artifact (e.g. a generated document or code file). |
| Cost per Code File | total_cost / code_files_generated | Cost per generated code file - tracks coding agent efficiency. |
| Cost per Tool Call | total_cost / tool_call_count | Cost per tool invocation in agentic workflows. |
Token and caching KPIs:
| KPI | Formula | What it tells you |
|---|---|---|
| Output:Input Ratio | output_tokens / input_tokens | How many output tokens the model generates per input token. Low ratios on generative tasks may signal over-stuffed prompts. |
| Cache Hit Rate | cached_input_tokens / total_input_tokens | Share of input tokens served from cache. Higher is better - every cache hit avoids a full-price input charge. |
Spend and productivity KPIs:
| KPI | Formula | What it tells you |
|---|---|---|
| Priority Tier Premium | priority_cost / standard_cost - 1 | How much more you're paying for priority/elevated service tiers vs. standard. |
| Avg AI Spend per Active User | total_ai_cost / active_user_count | Per-user AI cost, useful for per-seat budgeting and license decisions. |
| PRs per Engineer | total_pull_requests / active_engineer_count | Developer throughput metric. |
Provider badgesEach KPI card shows colored badges (e.g. A for Anthropic, O for OpenAI, G for Google) indicating which providers contribute data to that metric. Not all providers report all metrics.
KPI trend chart
Below the summary cards, a trend line shows the selected KPI over time. You can overlay up to 2 KPIs on the same chart to compare trends (e.g. Blended Cost / 1M Tokens alongside Cache Hit Rate). Toggle between 30D and 90D windows.
Cost per 1M Tokens by Model
A horizontal bar chart ranking models by input and output token cost. Toggle the unit between KTok (per 1,000 tokens) and MTok (per 1,000,000 tokens). Each row shows the model name with separate INPUT and OUTPUT cost columns.
Use this panel to compare pricing across models at a glance - for example, if Claude Fable 5 costs $15 input / $75 output per MTok while Claude Sonnet 5 costs $3 / $15, switching lower-complexity tasks to Sonnet delivers immediate savings.
Cost per Request by Model
A horizontal bar chart showing the average cost per API request by model, calculated as total_cost / request_count. This combines token pricing and typical request size, so a cheap-per-token model that receives long prompts may still have a high cost per request.
Token Efficiency by Use Case
Cards showing the output-to-input token ratio for each use case category. Each card displays the ratio (e.g. 1:3.2 in:out for Code Generation) and a bar showing the input/output percentage split.
Use cases with high output ratios (Code Generation, Documentation, Test Writing) are generative workloads - they're expected to produce more output than input. Use cases with high input ratios (Code Review, Debugging) are analytical - they consume long contexts and produce short assessments. If an analytical use case shows unexpectedly high output, it may be generating verbose responses that could be trimmed with prompt tuning.
Input vs. Output Tokens
A daily volume bar chart showing total input and output tokens over time, broken down by provider. Use this to spot volume trends - a sudden spike in output tokens without a corresponding input increase may indicate a change in model behavior or prompt configuration.
Optimize model selection with Tokenomics
- Open the Tokenomics dashboard.
- Review the Cost per 1M Tokens by Model panel to identify which models are most and least expensive.
- Cross-reference with Cost per Request by Model - a model with low per-token cost but high per-request cost may be receiving unnecessarily long prompts.
- Check Token Efficiency by Use Case to understand which workloads are generative vs. analytical, and match model tier to workload complexity (e.g. route Code Review to a lighter model since it's input-heavy with short output).
Validate caching ROI
- Check the Cache Hit Rate KPI card. A rate above 50% means most repeated prompts are being served from cache.
- Compare the Blended Cost / 1M Tokens trend over 30D or 90D. If cache hit rate is rising and blended cost is falling, your caching investment is paying off.
- If cache hit rate is low, review the token breakdown in the AI Cost & Usage Explorer to see which token types (ephemeral 5m vs. 1h) are being created and whether cache reads are actually occurring.
Updated 13 days ago