
Creating Business Mapping
Overview
An AI Business Mapping is a collection of rules that enables you to get granular visibility into how much each business unit costs you—whether it is the cost of serving your customers, internal projects, departments, or AI-powered product features. This data unlocks your ability to make better decisions: from user pricing and model selection to renewal strategies and feature profitability.
Examples of AI Business Mapping Viewpoints include:
- AI Product / Feature: Track costs of individual GenAI features (e.g., Support Bot, Code Assistant, Document Summarizer) from development to production across providers like OpenAI, AWS Bedrock, and Azure OpenAI.
- LLM Model & Provider: Monitor spending across different model families (e.g., GPT-4o, Claude 3.5, Llama 3, Custom Fine-tuned) to analyze efficiency and token costs across teams.
- Organization: Determine which departments (e.g., R&D, Marketing, Customer Success) drive AI expenses and hold each unit accountable for token consumption.
In this guide, we will walk you through:
- How to create a Viewpoint
- Creating Mapping Rule Groups
- Exploring Business Mapping logic on the AI Cost & Usage Explorer page
How to create a Viewpoint
- In the Navigation Panel, click AI Cost > AI Business Mapping.
- Click + New Viewpoint.
- Enter a name for the Viewpoint, and then click Save. The new Viewpoint is added to your Viewpoint dashboard.
- Click on the newly created Viewpoint.
- Click + New Mapping and then select the following:
-
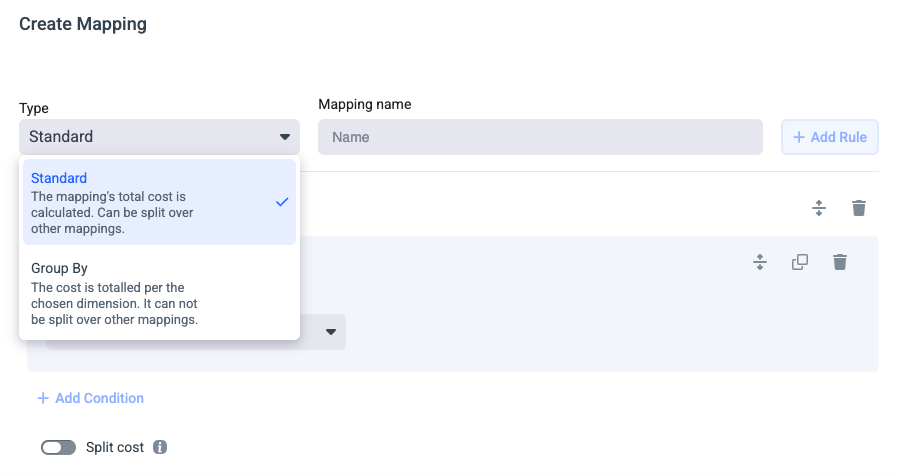
Select the Standard type of mapping (this is the old legacy type of rule).
-
Create New Mapping: Identify unit costs by filtering across specific AI dimensions (such as Users, Model IDs, Workspaces, API Keys, or Tags). Combine multiple rules using AND/OR operators, then click Save.
-
(Optional) Split Shared Costs: Distribute shared AI infrastructure across target mappings using Equal, Direct Spend Ratio, Monthly Proportional, or Custom Percentage splits.
>>Learn More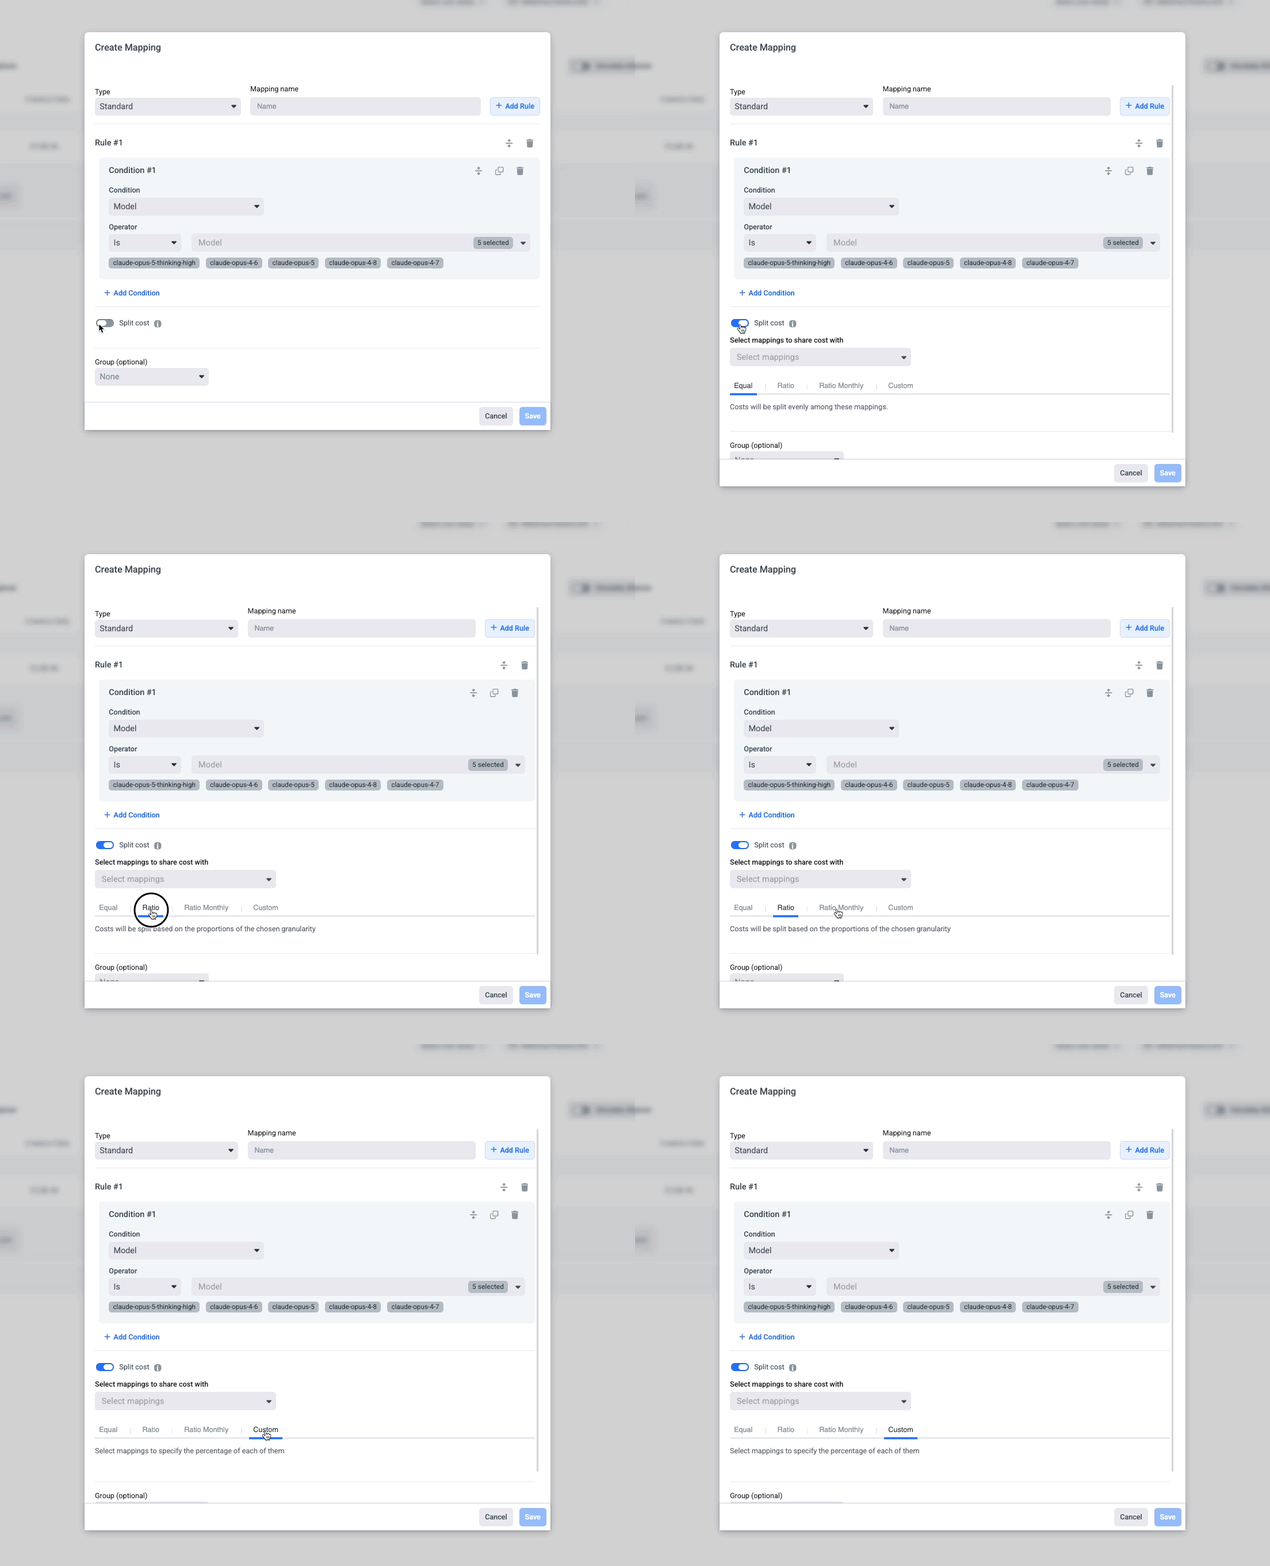
-
Mapping Rules Groups
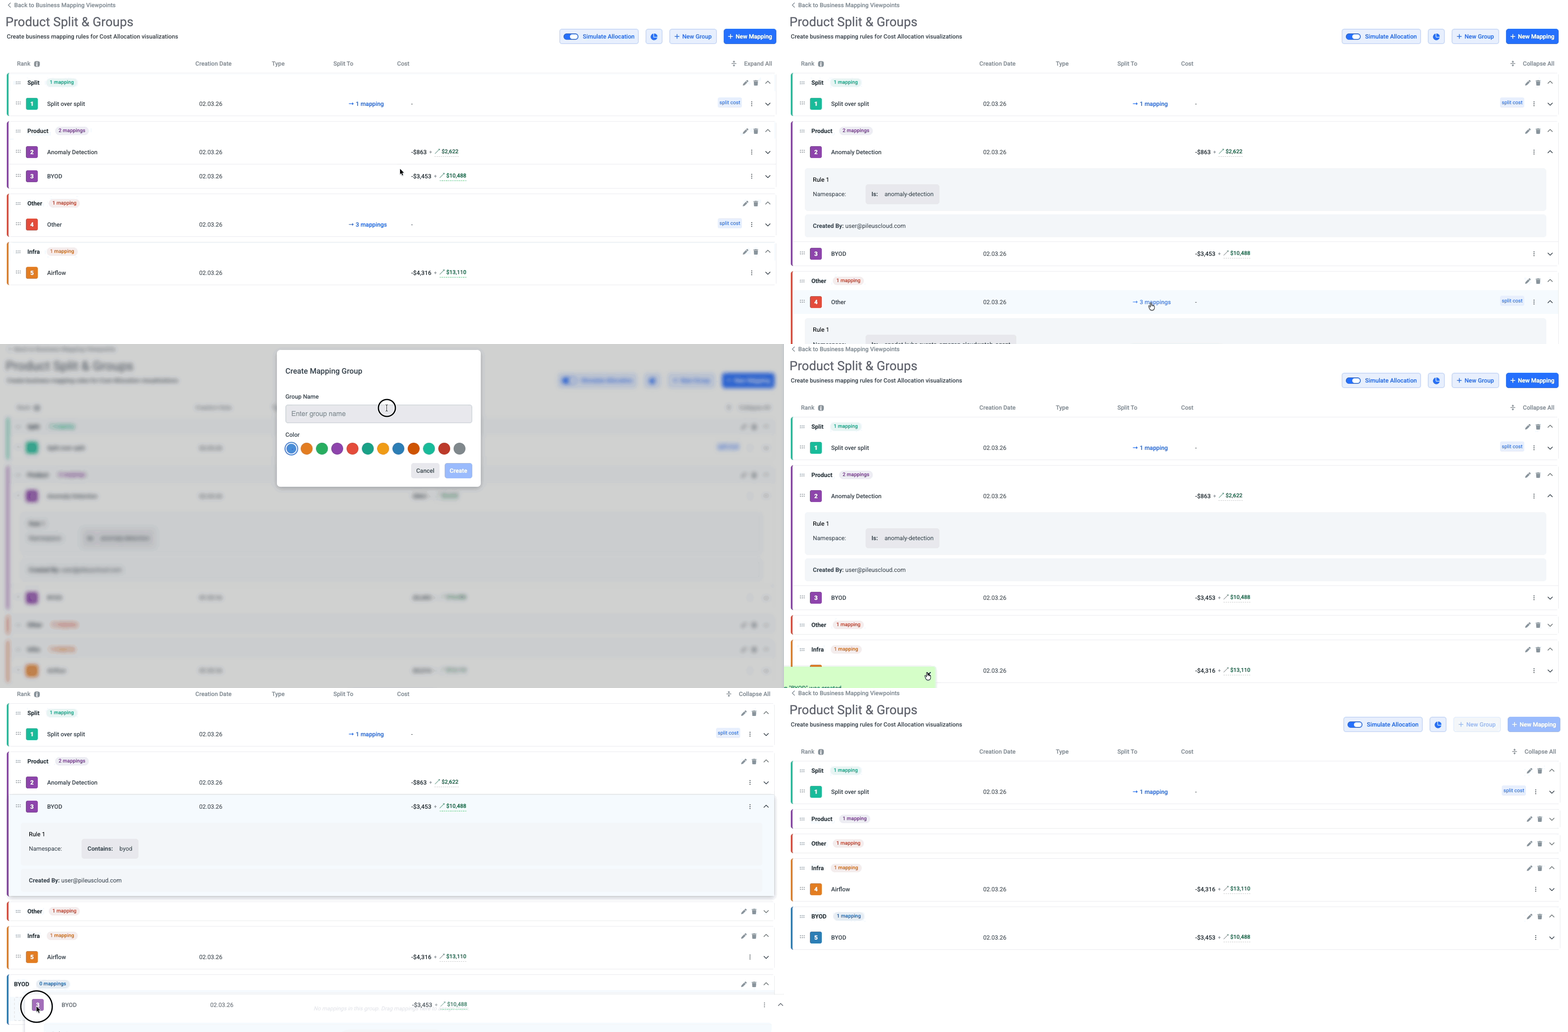
Organize your AI cost allocation rules into custom groups with color coding to easily segment mappings by customer tier, department, or AI feature category.
-
Focused Management: Each group displays the total number of mappings it contains and can be collapsed or expanded for clean navigation.
-
Shared Cost Visibility: View which mappings split costs from shared resources directly in the main table, complete with visual breakdowns of split amounts, percentages, and allocation logic.
-
Live Cost Simulation: An always-visible simulation panel shows real-time cost distribution across all your mappings, helping you preview and validate allocation rules before saving changes.
Viewing unit costs in the AI Cost & Usage Explorer
Once your Viewpoints are configured, you can use them as primary analytical dimensions in the AI Cost & Usage Explorer:
- In the Navigation Panel, click AI Cost > AI Cost & Usage Explorer.
- Grouping by Viewpoint: In the Group By dropdown menu, select Business Mapping Viewpoints and choose your desired Viewpoint. Use the search bar if you have multiple Viewpoints configured.
- Filtering by Mapping: To isolate a specific business unit or feature, apply a filter using your defined mapping rules.
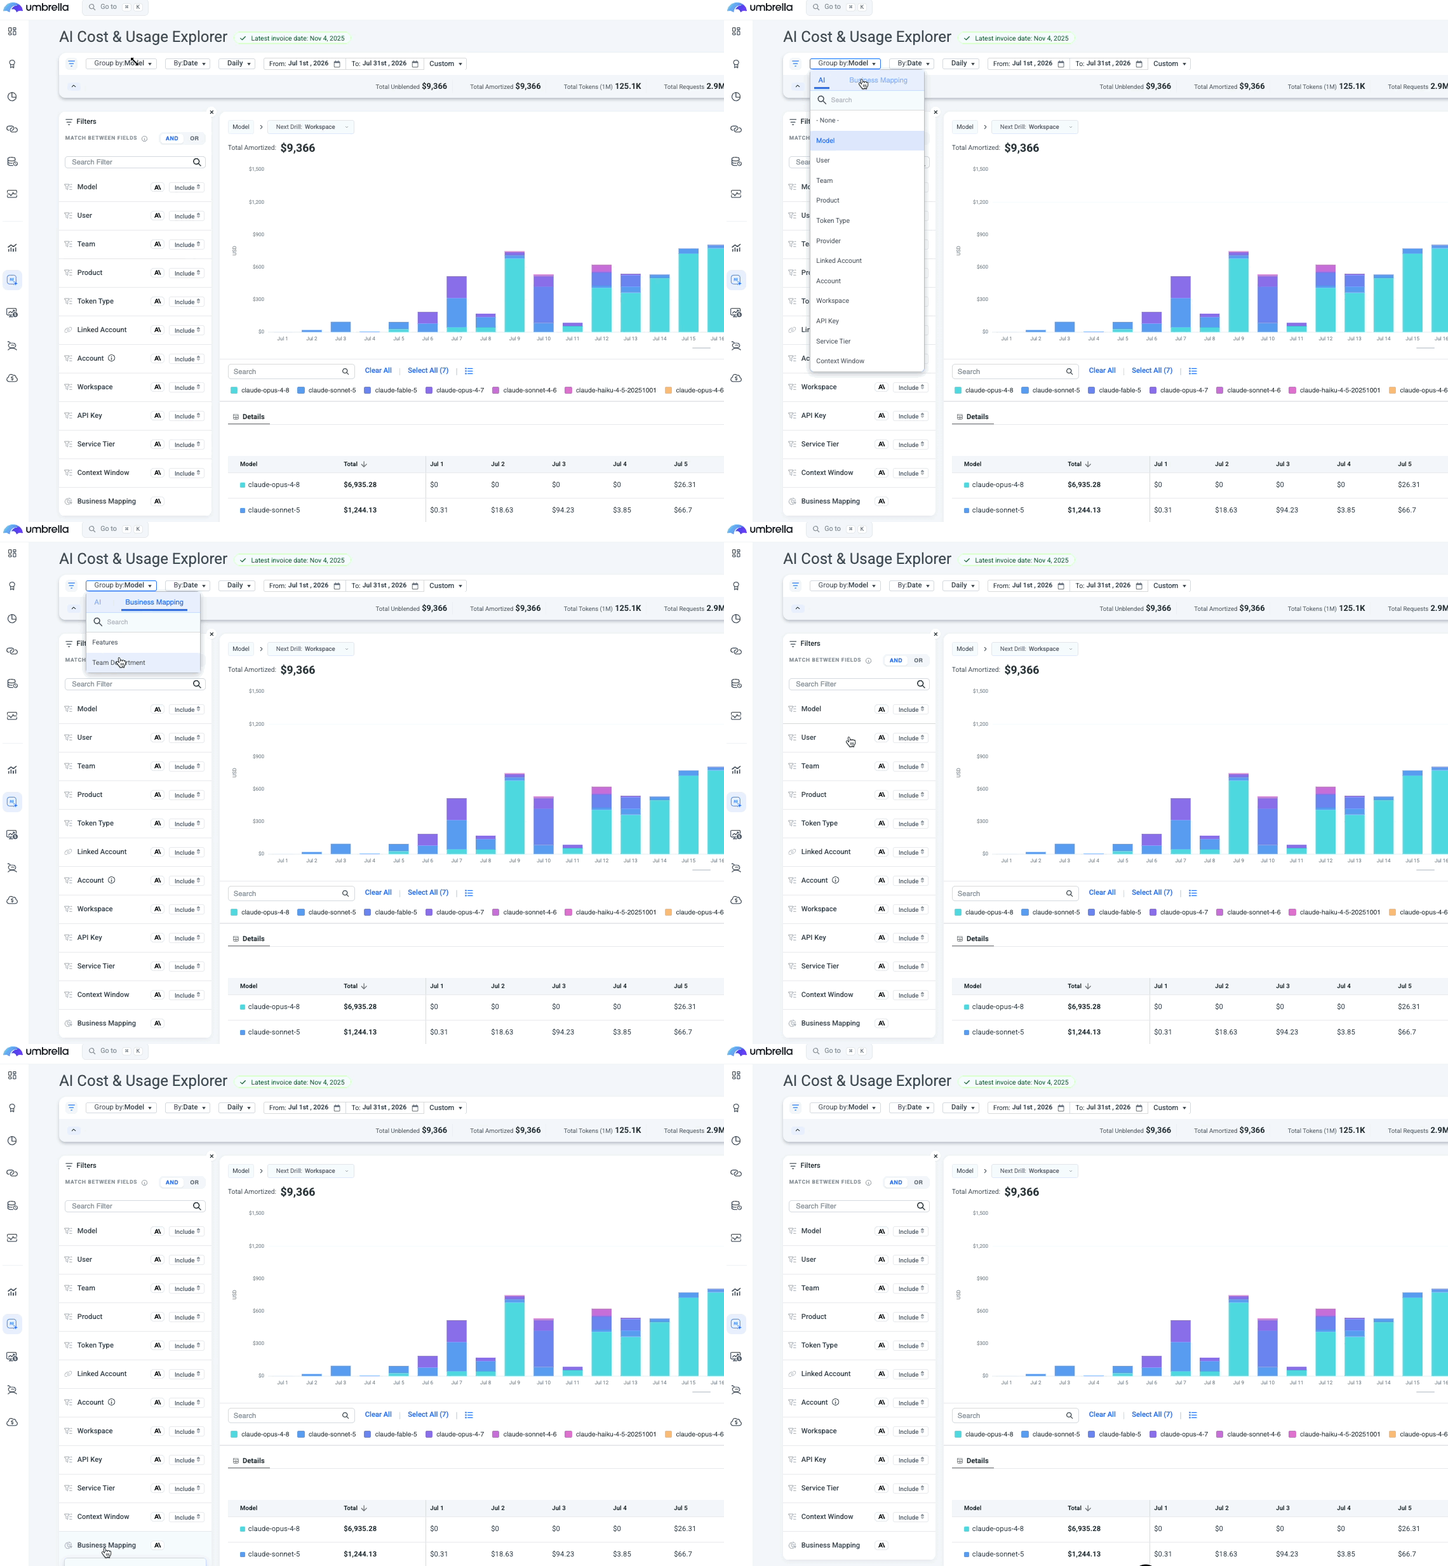
Pro-Tip: Tracking Unallocated AI Spending > To identify unmapped cost, simply Group By your Viewpoint in the AI Cost & Usage Explorer without applying any additional filters. The platform will automatically group and display all remaining unmapped AI spend as Unallocated.
Updated about 2 months ago