
Analytics - User Activity
Overview
The User Activity tab in AI Analytics gives a per-user view of AI usage and cost across every connected AI provider. Set monthly budgets, see which users and teams are over them, find idle seats, and drill into any user's usage per provider.
Why it matters
AI tools are typically billed per seat and per usage across several vendors, which makes it hard to tell who is driving cost and whether seats are being used. User Activity scores every user against a budget you define, so you can spot cost-reduction targets and unused licenses at a glance.
Set a budget
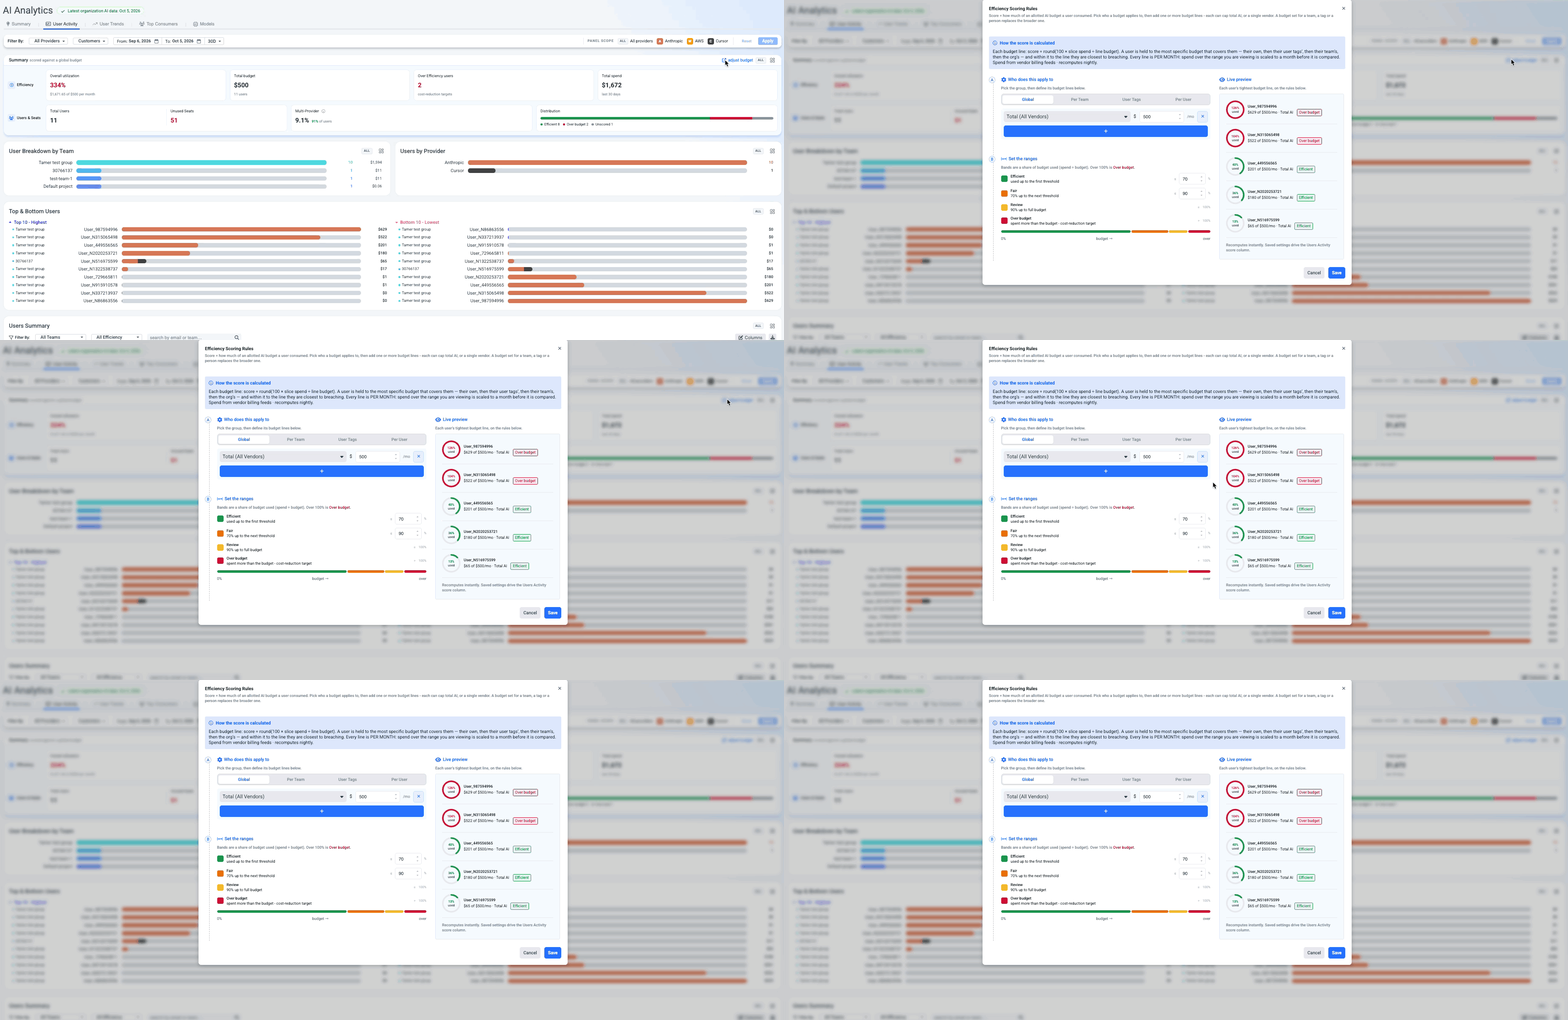
Click Adjust Budget in the top-right of the Summary panel to open Efficiency Scoring Rules. The budget you save here drives the efficiency scores on this tab and the Budget Used chart in User Trends.
- Who does this apply to - choose Global, Per Team, User Tags, or Per User.
- Add one or more budget lines. Each line caps either Total (All Vendors) or a single vendor, as a monthly amount ($/mo). Click + to add a line.
- Set the ranges - define the share of budget used for each band:
Band Default Efficient up to 70% Fair 70% up to 90% Review 90% up to 100% Over budget More than 100% - cost-reduction target - Check the Live preview, then click Save.
Understand the panels
Summary - KPIs scored against the budget:
| KPI | What it shows |
|---|---|
| Overall utilization | Total spend as a share of the monthly budget. |
| Total budget | Monthly budget and number of users it covers. |
| Over Efficiency users | Users over budget - cost-reduction targets. |
| Total spend | AI spend for the selected period. |
| Total Users / Unused Seats | Active users, and paid seats not in use. |
| Multi-Provider | Share of users active on more than one AI provider. |
| Distribution | Users per efficiency band, plus Unscored. |
| Panel | What it shows |
|---|---|
| User Breakdown by Team | Users and spend per team. |
| Users by Provider | Number of users per AI provider. |
| Top & Bottom Users | The 10 highest- and 10 lowest-spending users. |
| Seat Utilisation | Per provider: seats used vs. purchased, % utilized, and idle seats. |
Review individual users
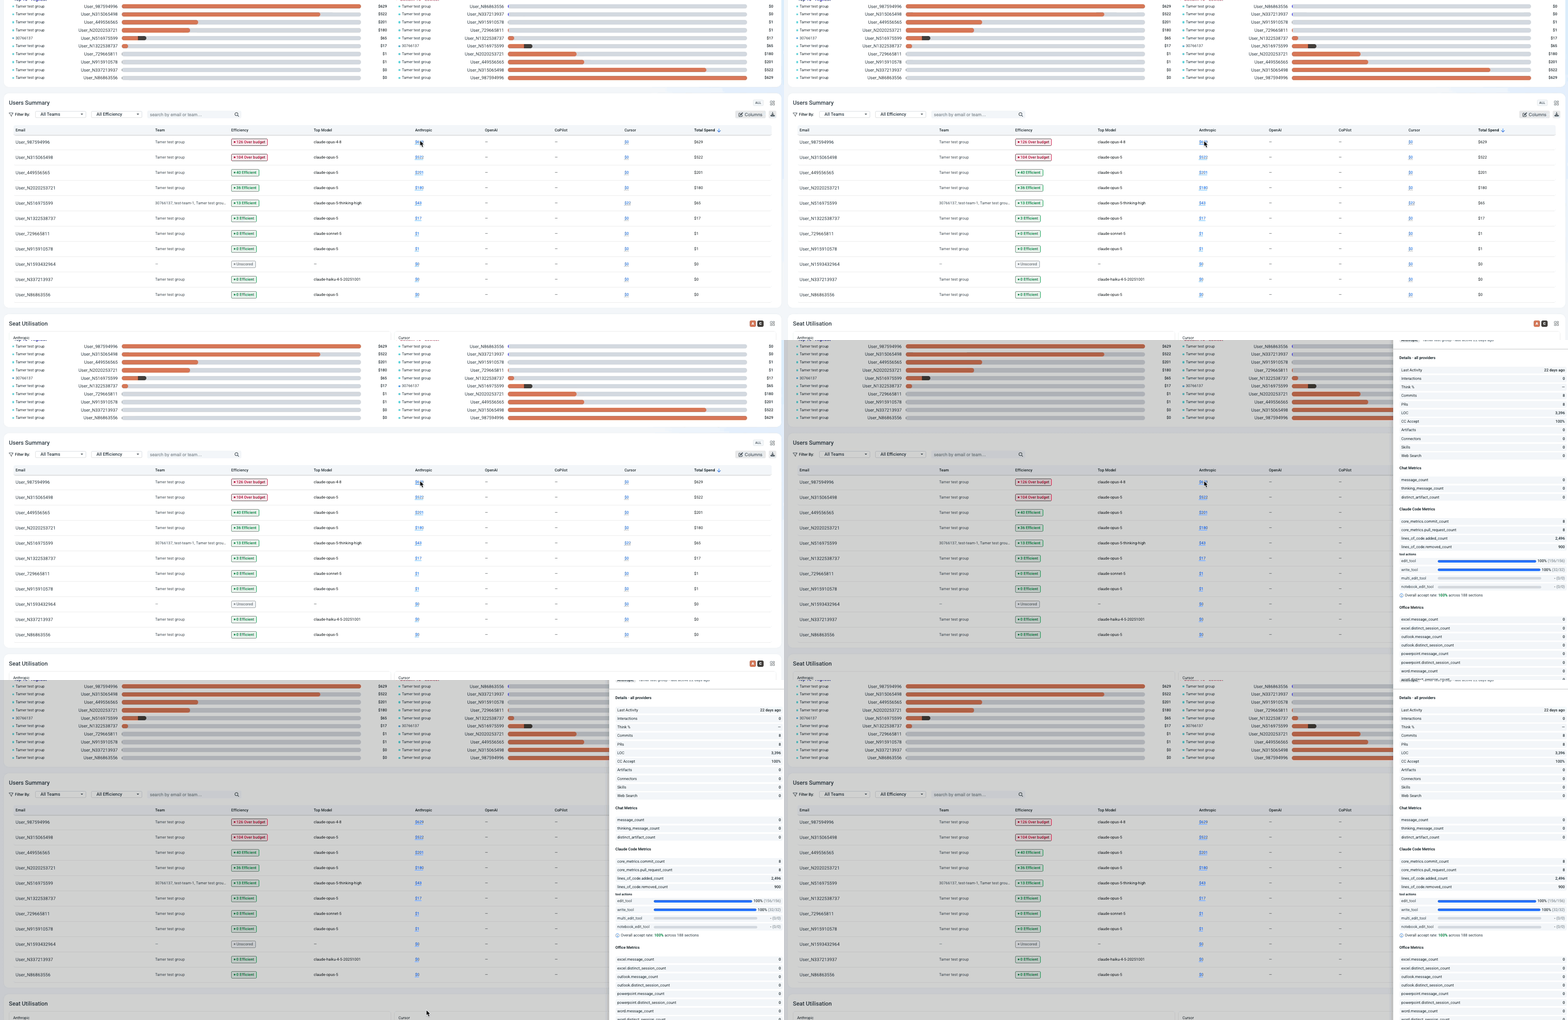
The Users Summary table lists every user with Team, Efficiency score and band, Top Model, spend per provider, and Total Spend.
- Filter by All Teams or All Efficiency, or search by email or team.
- Use Columns to show or hide columns, and the download icon to export the table.
Click a user's spend under any provider to open the user sidebar. It shows Details - all providers (for example, last activity, interactions, commits, PRs, lines of code, and accept rate), followed by usage metrics specific to that provider ->
Updated 1 day ago