
Use cases guide
Overview
This guide walks through the most common questions FinOps, finance, and engineering teams bring to the Cost & Usage Explorer, and shows which features to combine to answer each one. Each scenario takes a few minutes.
For a full description of every feature, see the Cost & Usage Explorer reference.
| Your question | Features you'll use |
|---|---|
| Why did my costs spike? | Table trend, sort, Show time range, drill-down |
| Is it usage or price? | Multi-measure |
| How do unblended and amortized cost compare? | Multi-measure, Multi chart view |
| How do costs flow between teams? | Business Mapping split view, Sankey |
| How do I filter by several conditions? | AND / OR filters |
| How do I get back to an earlier analysis? | Search history |
| My chart is too busy | Filter results |
Why did my costs spike?
When to use: Your bill or a budget alert shows an increase, and you need to find the cause.
- Set a date preset such as Last 30 Days and group by Service.
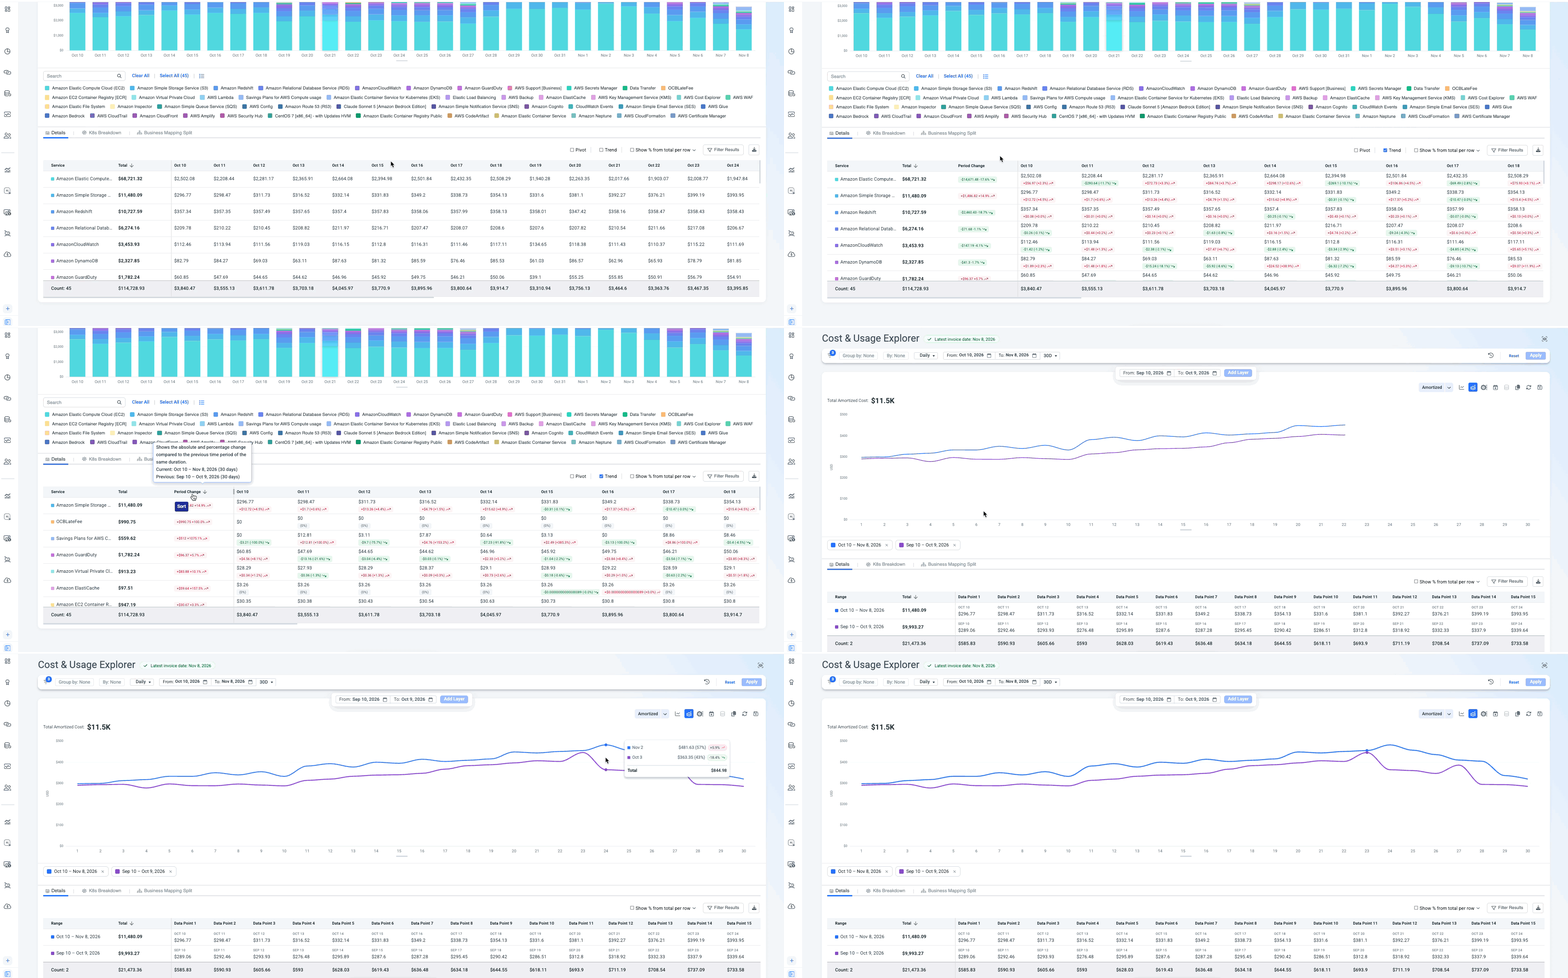
- In the table, turn on Trend to see the change in $ and % for every value.
- Sort by change to bring the values with the biggest increase to the top.
- Narrow it down:
- Filter to the top movers, or
- Click the change chip on a value. It opens Show time range with both periods plotted on the same chart, so you can see exactly when the increase started.
- Drill into the value to find the account, region, or resource behind the increase.
Result: You know what grew, by how much, since when, and what's driving it.
Is the increase from usage or price?
When to use: Cost went up, and you need to know whether you're using more or paying more per unit - for example, before a commitment or pricing review.
- Filter to the service you're investigating.
- In the measure picker, keep your cost measure and add Usage (and Rate, if relevant).
- Use a Line chart. Cost and usage get separate axes automatically.
- Read the result:
- Cost and usage rise together - growth is usage-driven.
- Cost rises while usage stays flat - the rate changed. Check pricing, discounts, or commitment coverage.
TipAdd a unit economics KPI, such as Cost per Request, to see whether you're getting more efficient as you scale.
Compare cost types side by side or on one chart
When to use: You need to see two views of the same spend together - for example, Unblended vs. Amortized cost, to understand the effect of commitments and upfront payments.
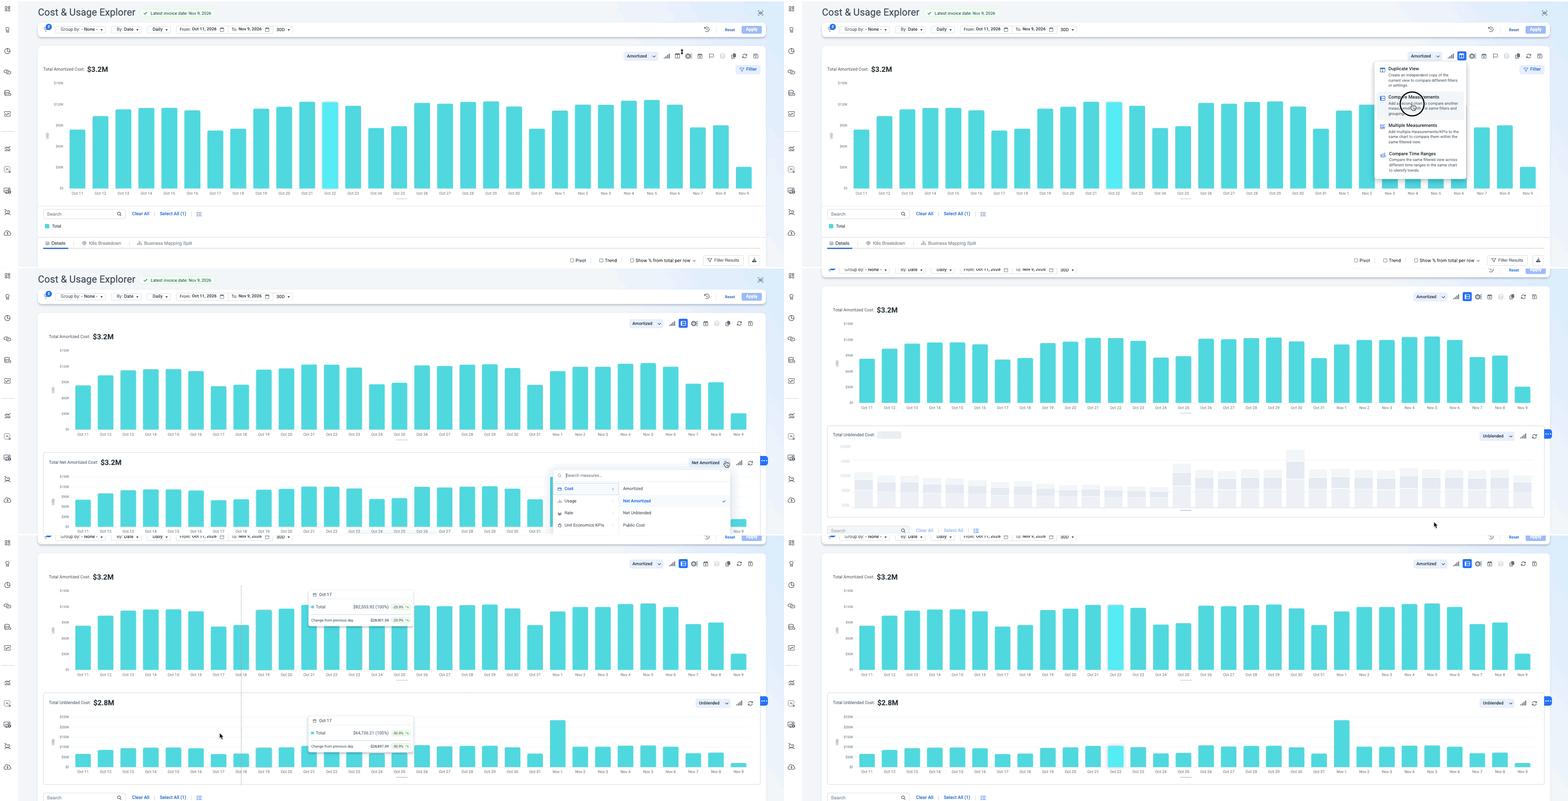
Set your filters once, then pick the layout that fits:
| Layout | How | Best for |
|---|---|---|
| On the same chart (Multi-measure) | Select both measures in the measure picker | Seeing where the lines diverge at a glance |
| Next to each other (Compare measure) | Add a chart below the main one for the second measure | Reading each measure on its own scale |
In both layouts, the table shows each measure in its own column, side by side, and drill-downs apply to everything.
TipThe same approach works for any pair - cost and usage hours, cost and carbon emissions, or up to 10 measures on one chart.
See how shared costs flow and split
When to use: You allocate shared costs (platform, networking, support) with Business Mapping, and teams ask where their charges come from.
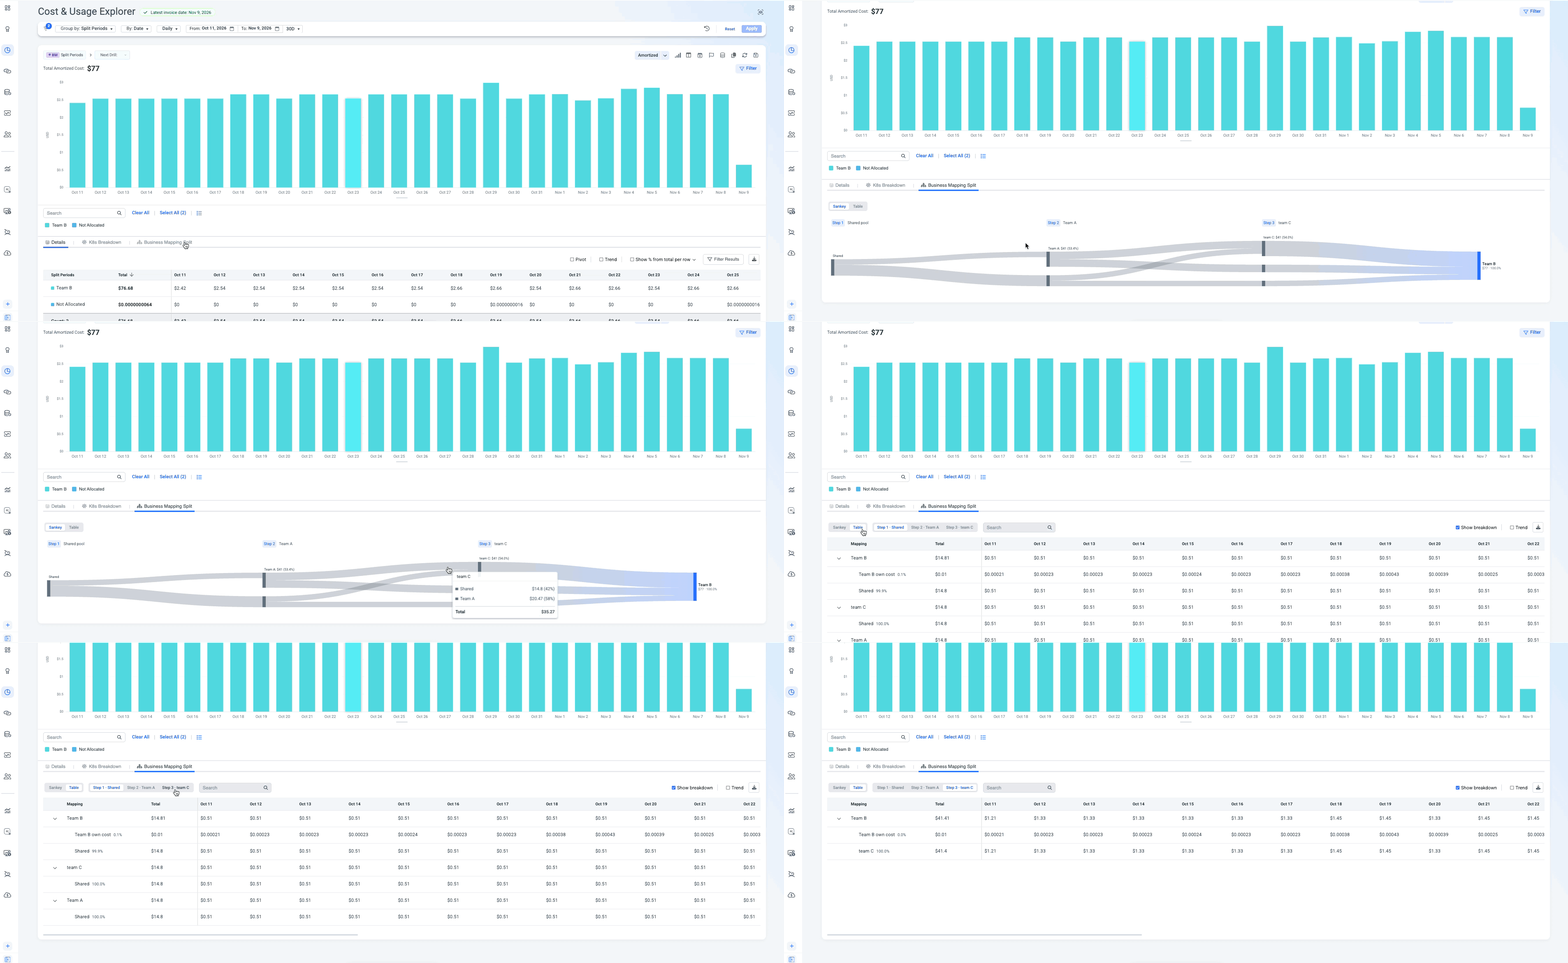
- Group by a Business Mapping that uses split costs.
- Open the Business Mapping Split tab under the chart.
- Use the Sankey view to see the cost flow - from the original source, through each allocation step, to the team or product that ends up owning it.
- Switch to Table to see the exact numbers. Each team's cost is broken down by source - for example, Team C's $100 = $50 from Product A + $50 from Product B.
- To explain one value, drill with Business Mapping Allocation path.
- Download as CSV to share with the team or finance.
Filters don't change allocationFiltering narrows what you see in the Sankey and table. It doesn't recalculate how costs are allocated.
Combine filters with AND / OR
When to use: One filter isn't enough - for example, "EC2 or RDS costs" or "Production tag and us-east-1 region".
- Add the filter values you need.
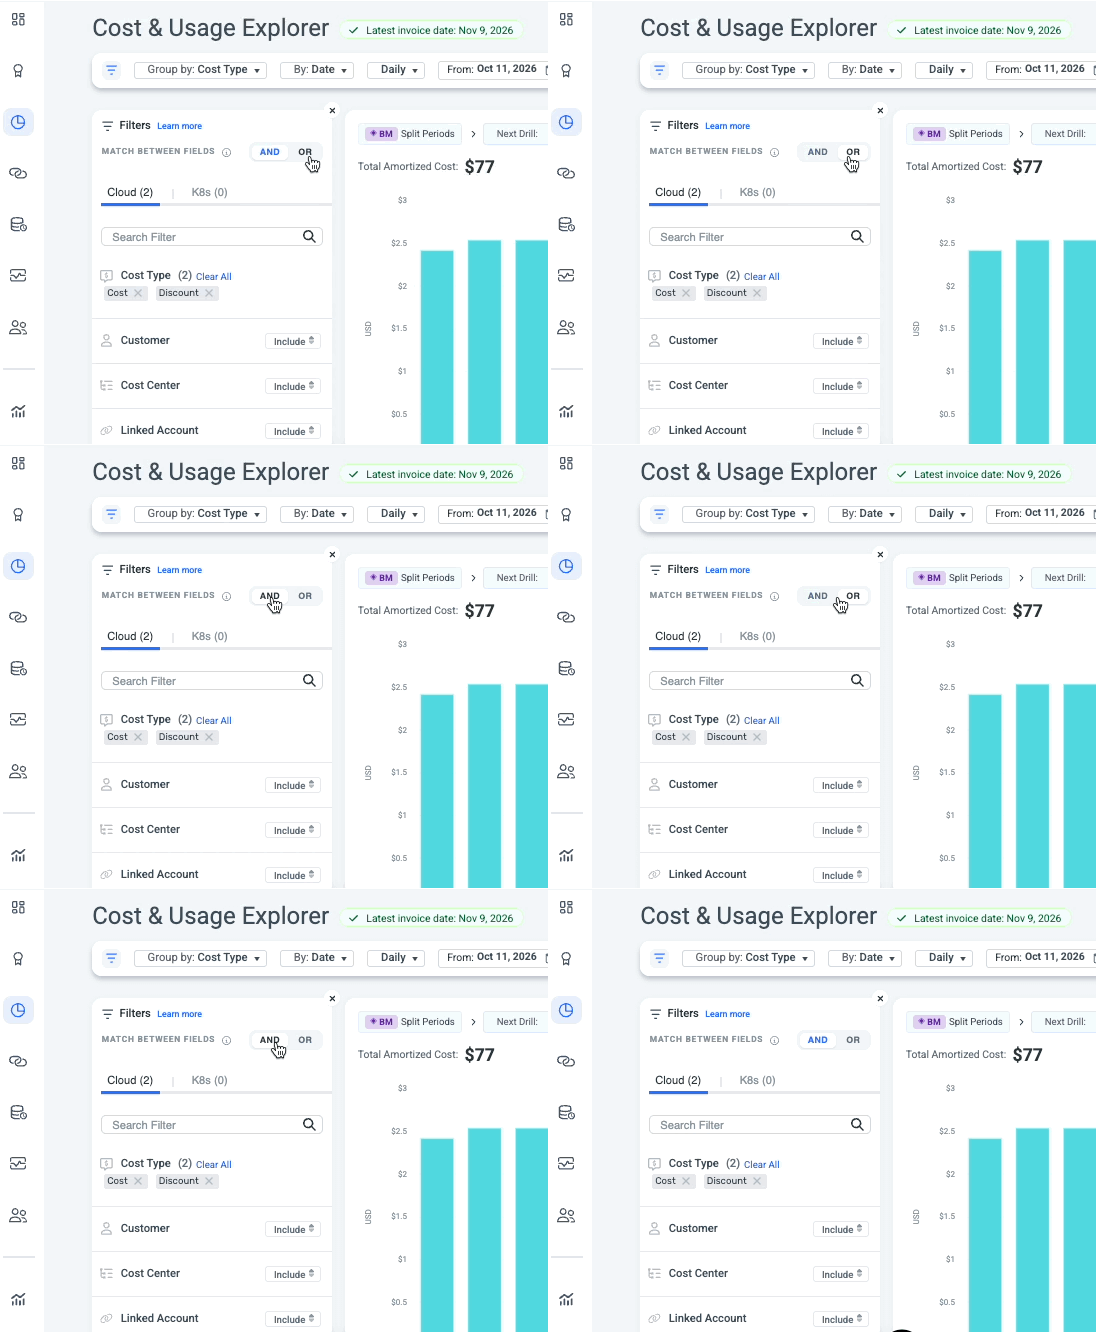
- Set the operator:
- OR - show data matching any of the values. Use it to look at a group of services, accounts, or tags together.
- AND - show only data matching all conditions. Use it to zero in on a specific slice.
- Save the result as a view so you don't need to rebuild it.
Save a view and come back to it
When to use: You want to reopen a setup without rebuilding it, or help someone with a question about their view.
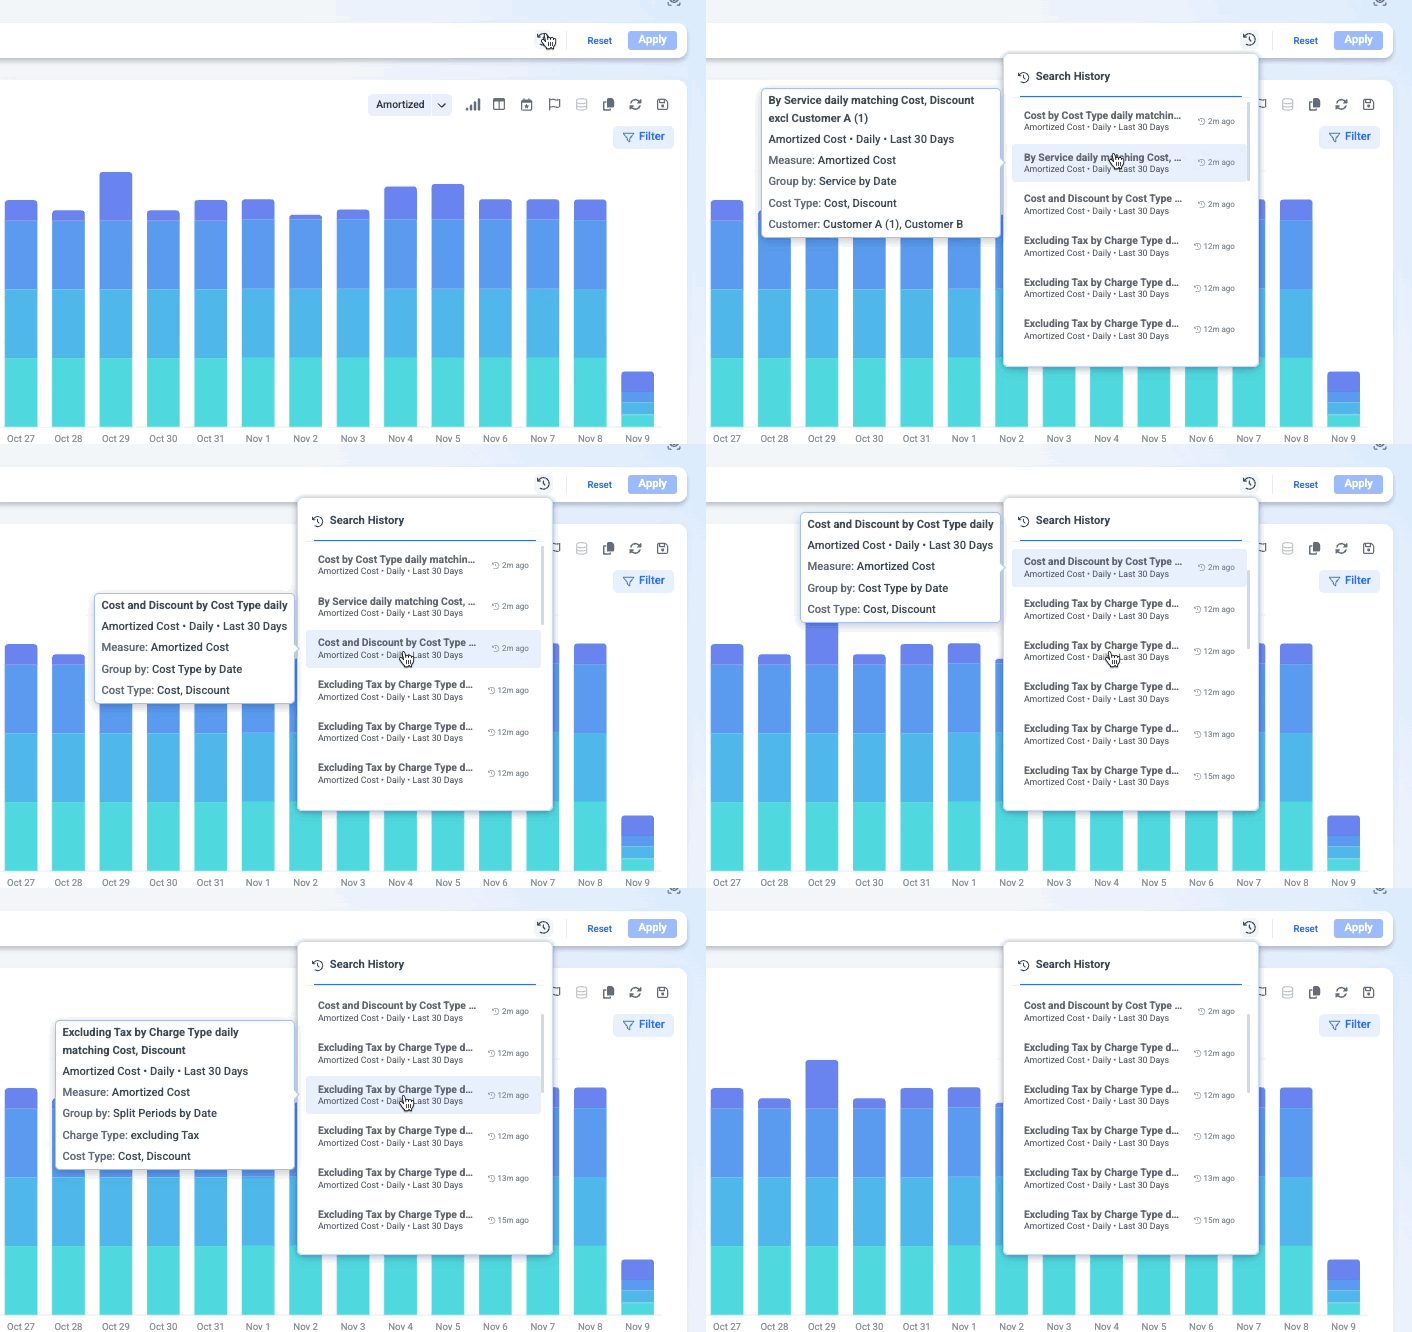
- Mid-investigation - Open Search history and click an earlier search to return to that exact point.
- Helping a customer or colleague - Impersonate them, open Search history, and click the search they asked about. You'll see their exact filters and data.
Cut through a busy chart
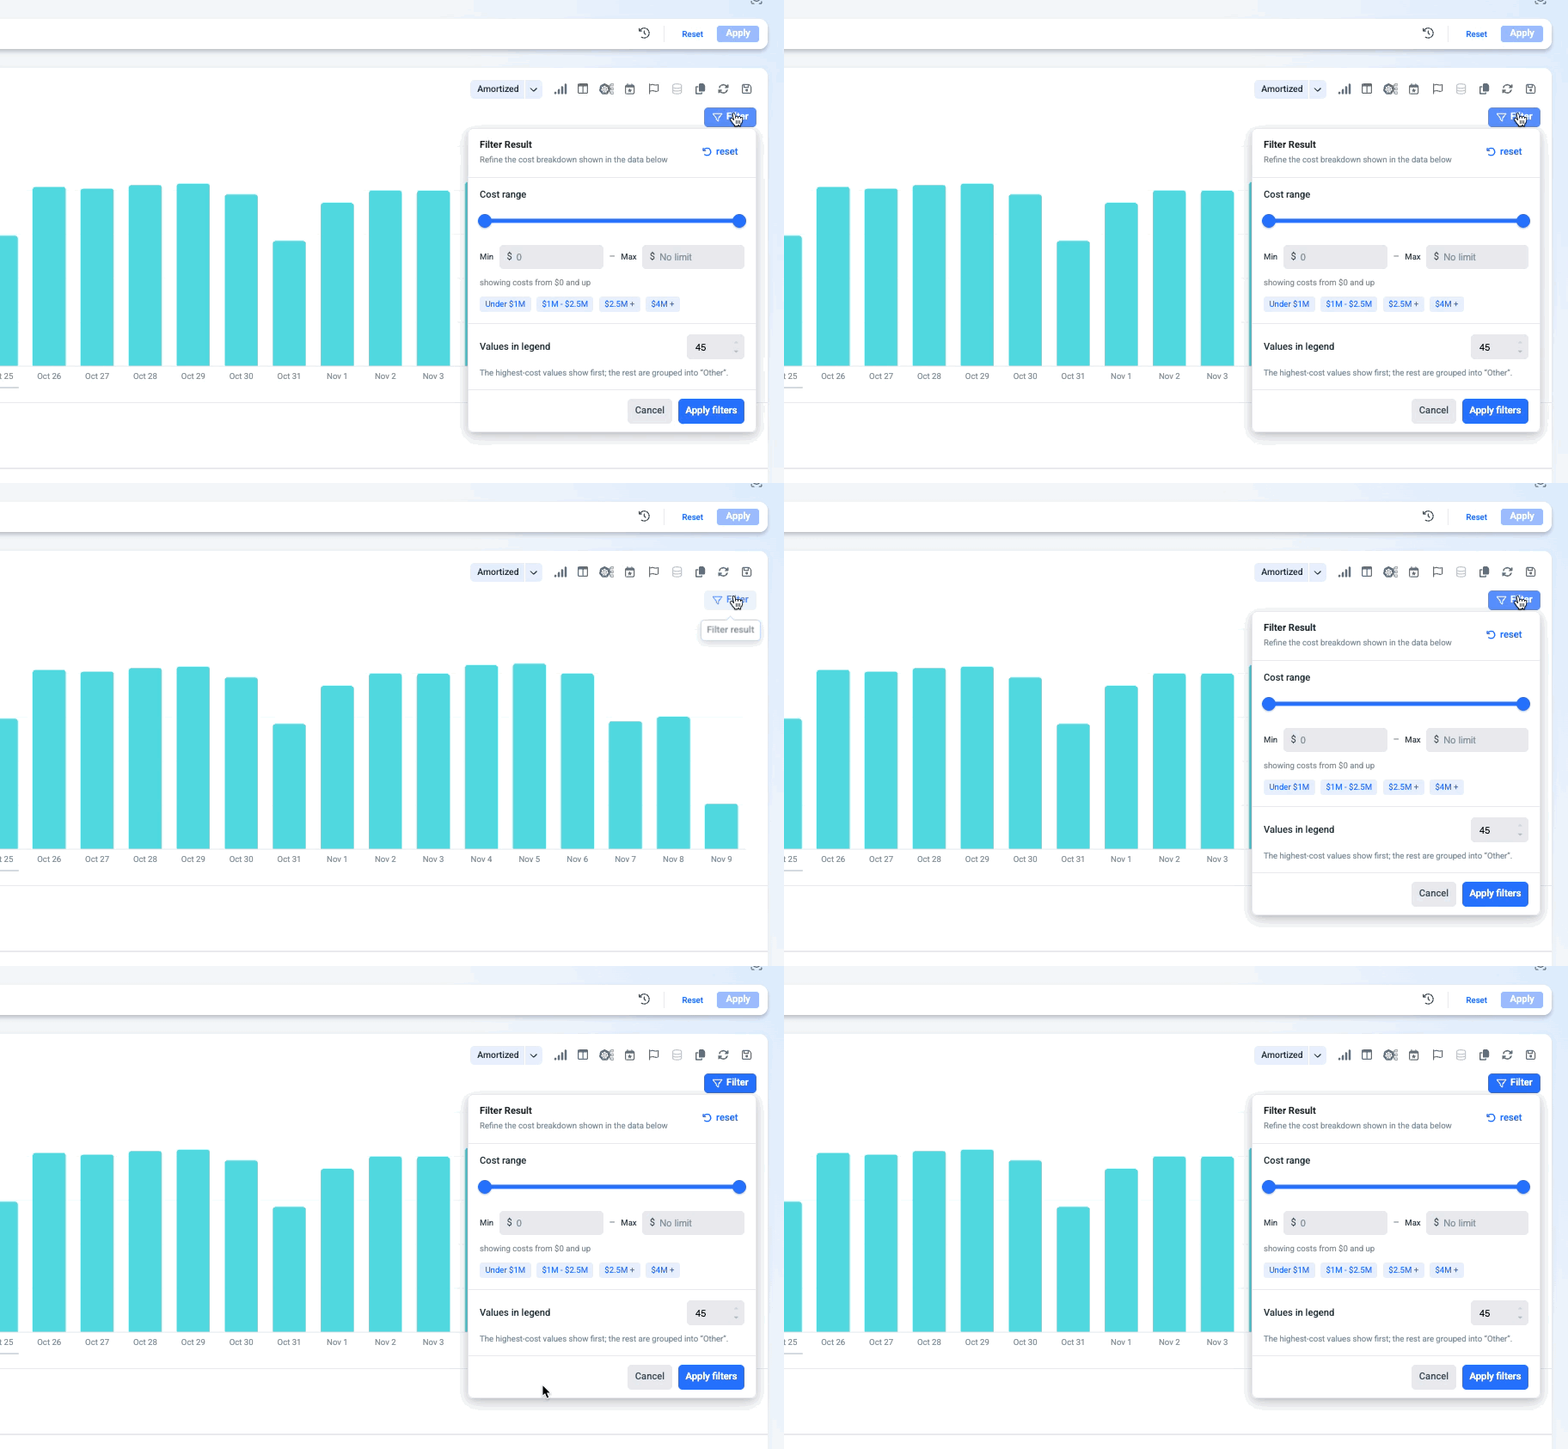
When to use: Your grouping returns dozens of small values and the chart is hard to read.
- Open Filter results next to the chart.
- Choose Top values and set a number (up to 30) to keep only the largest items, or
- Set a cost range to hide items below a threshold.
Filter results applies to both the chart and the table, and doesn't change your filters.
Related
Updated about 14 hours ago