Metrics, Anomalies & Alerts
Overview
Umbrella Cost monitors cost metrics and identifies anomalies from your cost metrics normal behavior patterns.
(See Anomaly Detection for more details)
flowchart LR
 Metrics[Cost Metrics are analyzed] -.-> Anomalies[Anomalies are Detected]
 Anomalies -.-> Rules[Alert rules are defined]
 Rules -.-> Alerts[Alerts are triggered according to Alert Rules]
- The anomaly detection engine runs on a daily basis, processing up to 4 previous months of cost data.
- Umbrella currently presents anomalies with impact >=50$ to reduce noise.
- For MSPs and their customers, the anomaly detection engine is invoked after each re-billing process.
The next sections include:
Cost Metrics
The cost anomaly engine processes a predefined set of cost metrics and these are optimized and set to reduce the noise and automatically create added-value anomaly insights.
NoteThe Umbrella Cost algorithm filters in 'On demand' anomalies and these are presented in the Anomaly detection monitoring UI.
The list of predefined metrics is listed in the following table:
Cloud Provider | Customer Type | Metrics | Dimensions |
|---|---|---|---|
AWS | Direct customers | Amortized cost |
|
Azure | Direct customers | Actual/Amortize Depending on the invoice exported metric |
|
GCP | Direct customers | Unblended cost/Amortized Depending on the invoice exported metric |
|
AWS | MSP Users | Amortized cost |
|
Azure | MSP Users | Actual/Amortized Depending on the invoice exported metric |
|
Azure | FOCUS Export | Actual |
|
GCP | MSP Users | Unblended cost/Amortized Depending on the invoice exported metric |
|
AWS | MSP Customers Dedicated account | Amortized cost |
|
AWS | MSP Customers Shared account | Unblended cost |
|
Azure | MSP customers | Actual/Amortized Depending on the invoice exported metric |
|
GCP | MSP customers | Unblended cost/Amortized Depending on the invoice exported metric |
|
Viewing your Anomalies
- From the left menu navigate to Monitoring > Anomaly Detection.
- There are two main views for the anomalies:
- The All anomalies tab - the central repository for all anomalies. displays all the anomalies with at least a 50$ cost impact. The tab lists the top 200 anomalies. You can also use the search bar to search for values across all the anomaly table fields.
- The Alerts tab - all the anomalies that were triggered according to the defined alert rule
- The "All anomalies" numbers refer to the open anomalies.

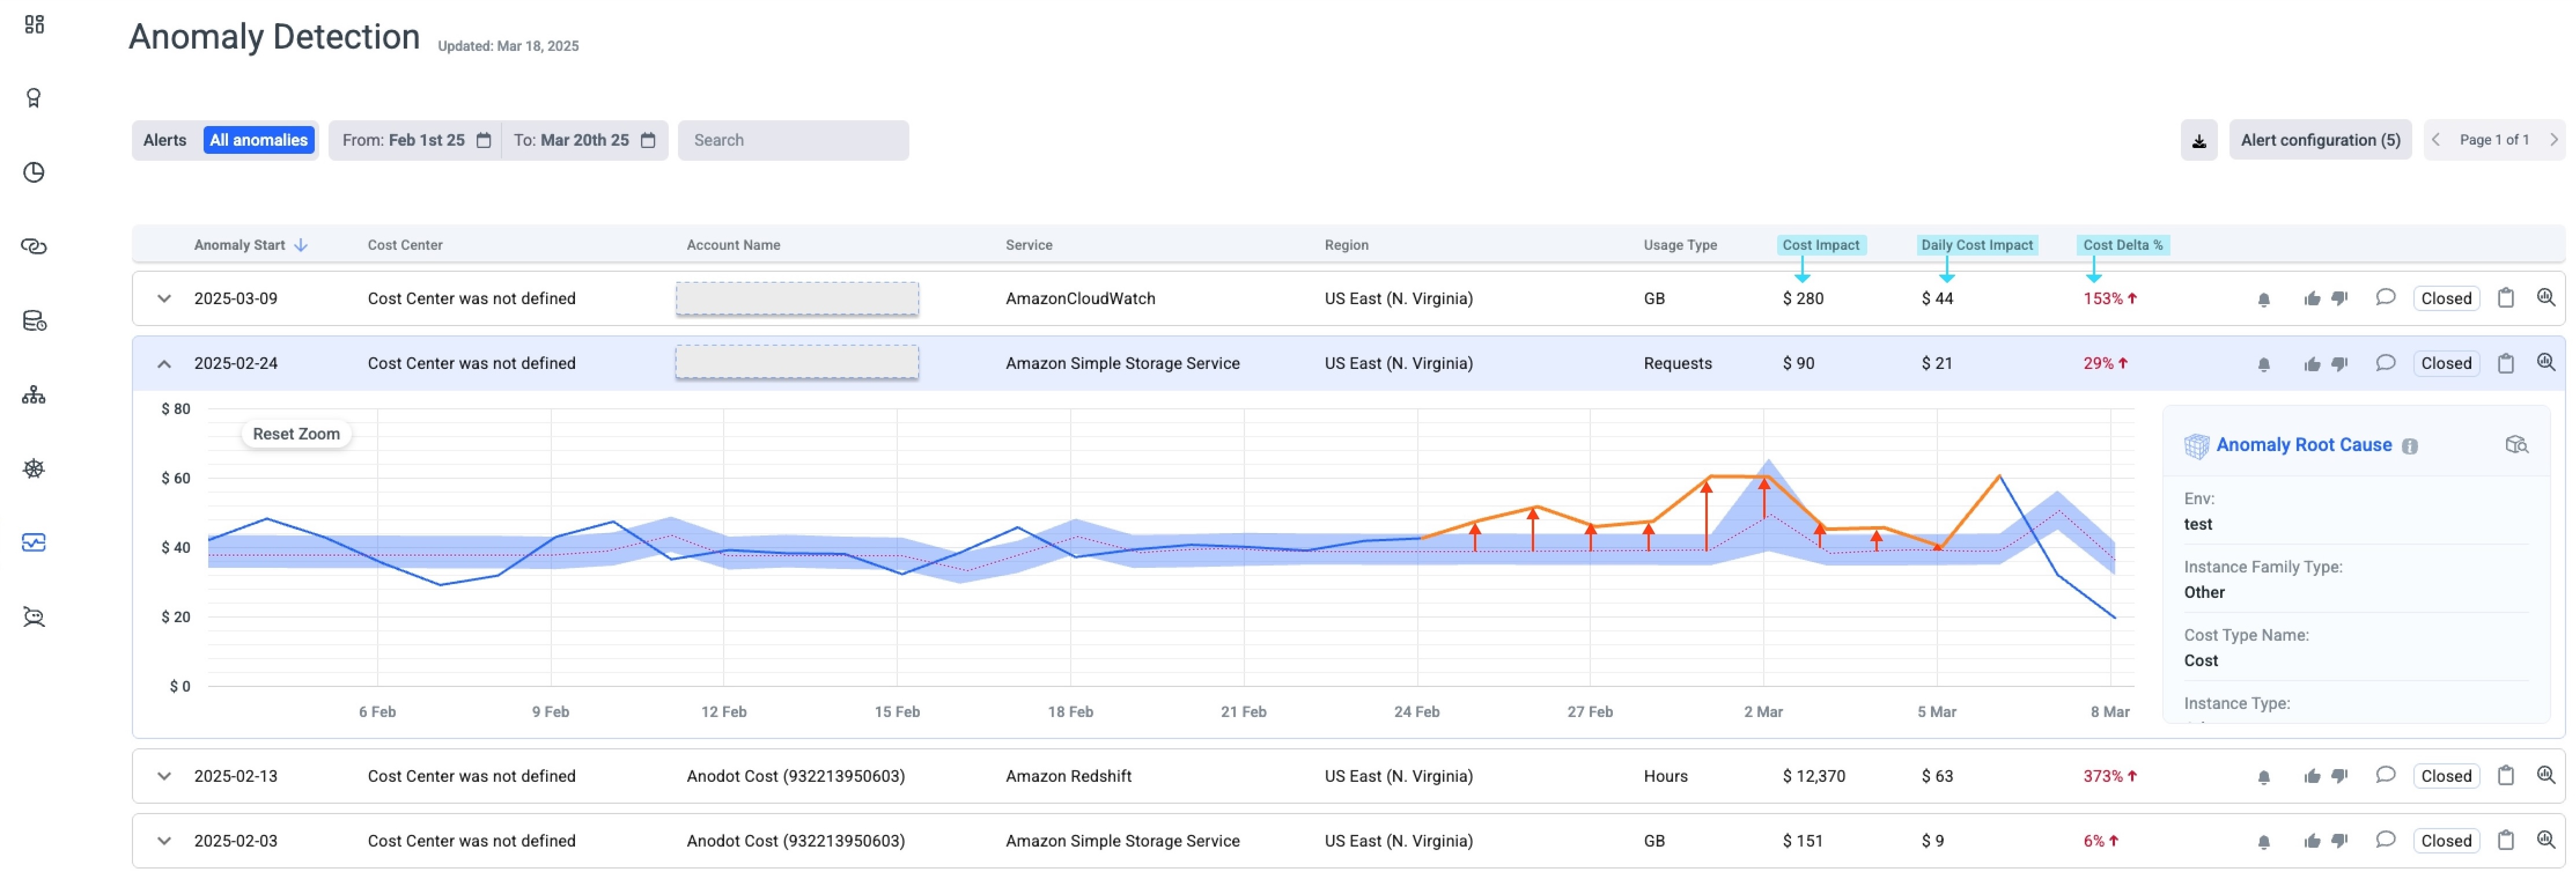
For each anomaly, you can see a detailed chart depicting anomaly behavior patterns and explanations pinpointing the primary parameters driving these anomalies.
In addition, you can add a comment, feedback and mark each anomaly as resolved / acknowledged.
The feedback is analyzed (mainly the NOT-INTERESTING feedback) to see how the Alert can be improved. This is where Umbrella Cost's machine-learning capability comes into place.

Anomaly detection cubelet
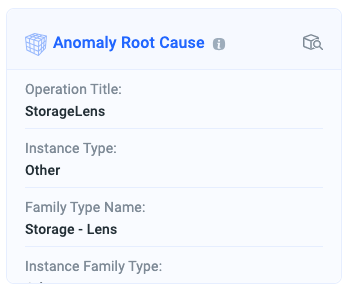
The Umbrella Cost platform provides anomaly root cause analysis (AKA: cubelet) by analyzing each underlying metric, looking only for the dimensions having anomalies during the same period, and covering at least 70% of the original anomaly impact.

Anomalies and Alerts combined View
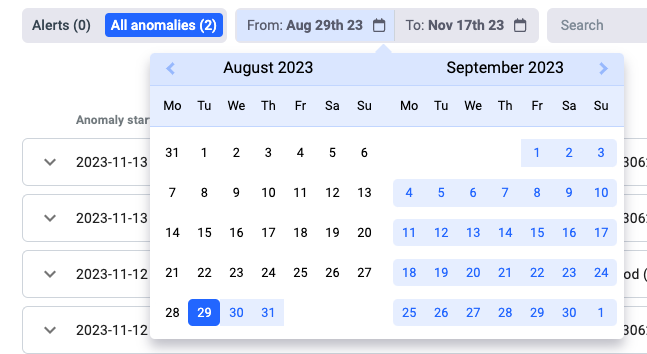
You can set a time range to explore anomalies for a given period of time.

The various columns and fields in the All anomalies tab are described below:
- Anomaly start time: The time at which the anomaly started.
- Customer: (Displayed for MSPs) The customer to whom the linked account belongs.
- Cost center: (Displayed for direct customers) The cost center to which the linked account is assigned.
- Account name: Account Name (ID), mapped from the Linked account / Subscription / Projected.
- Service: Cloud provider service.
- Region: Cloud provider region.
- Usage type: From one of Byte, Hours, Requests, Resource quantity, or Other.
- Cost impact: Represents the delta between the anomalous data point and the previous normal value, in $ value.
NoteThe anomaly cost impact is accumulated throughout the anomaly duration.
For example, if an anomaly lasted for 2 days, on day 1 the anomaly cost impact was 50$, and on day 2 the anomaly cost impact increased by 100$, which means that the accumulated anomaly impact is 150$.
- Cost delta %: Represents the delta between the anomalous data point and the previous normal value, in % value.
- Daily Cost Impact: The cost impact caused by the last day of the anomaly. This is the difference between the last datapoint and the expected median value in the baseline for that day (see image below)

Additional indicators in the Anomaly table

Indicates if the anomaly is open.

Indicates if the anomaly is closed.

Indicates if the anomaly has an open alert (hover over the icon to see the name of the alert rule that has triggered the open alert).

Indicates the anomaly has no open alerts.

Click to investigate the anomaly using the Cost & Usage Explorer. The trend chart time range is 3 months back from the anomaly start time.
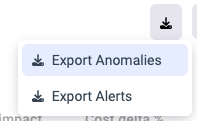
Download anomalies or Alerts
You can download all your anomalies (open, closed) into a CSV file.

Updated 2 months ago
