
AI Cost Overview
Umbrella AI Cost brings every AI provider - model APIs, per-seat assistants and AI running on your cloud providers - into a single view, so FinOps, finance and leadership can see what AI costs, understand whether that spend is efficient, and allocate every dollar to the business
Overview
Umbrella AI Cost brings every AI provider into a single view - usage-based model APIs (Anthropic, OpenAI, Google, AWS Bedrock), per-seat assistants (GitHub Copilot, Cursor, Microsoft 365 Copilot), and AI workloads running on your cloud providers. Each provider ships its own billing console, cost model and usage schema. Umbrella normalizes all of it, turns raw usage into unit economics, and enforces privacy and cost allocation consistently across every provider.
Why it matters
AI cost isn't one line item anymore. Organizations run a mix of providers, each with its own pricing model - per-token, per-request, per-seat, or bundled into cloud infrastructure bills. Without a single pane of glass, FinOps teams can't answer basic questions: what does AI actually cost us, is that spend efficient, and who should pay for it?
Umbrella AI Cost closes that gap so finance, FinOps and engineering leadership can catch overruns early, validate whether caching and model selection are working, prove unit economics without building a custom metrics layer, and charge back every dollar with confidence.
What you can do
Umbrella AI Cost provides visibility into every dimension of your AI spend - from high-level summaries and unit economics, through per-model and per-user drill-downs, to full cost allocation and privacy controls.
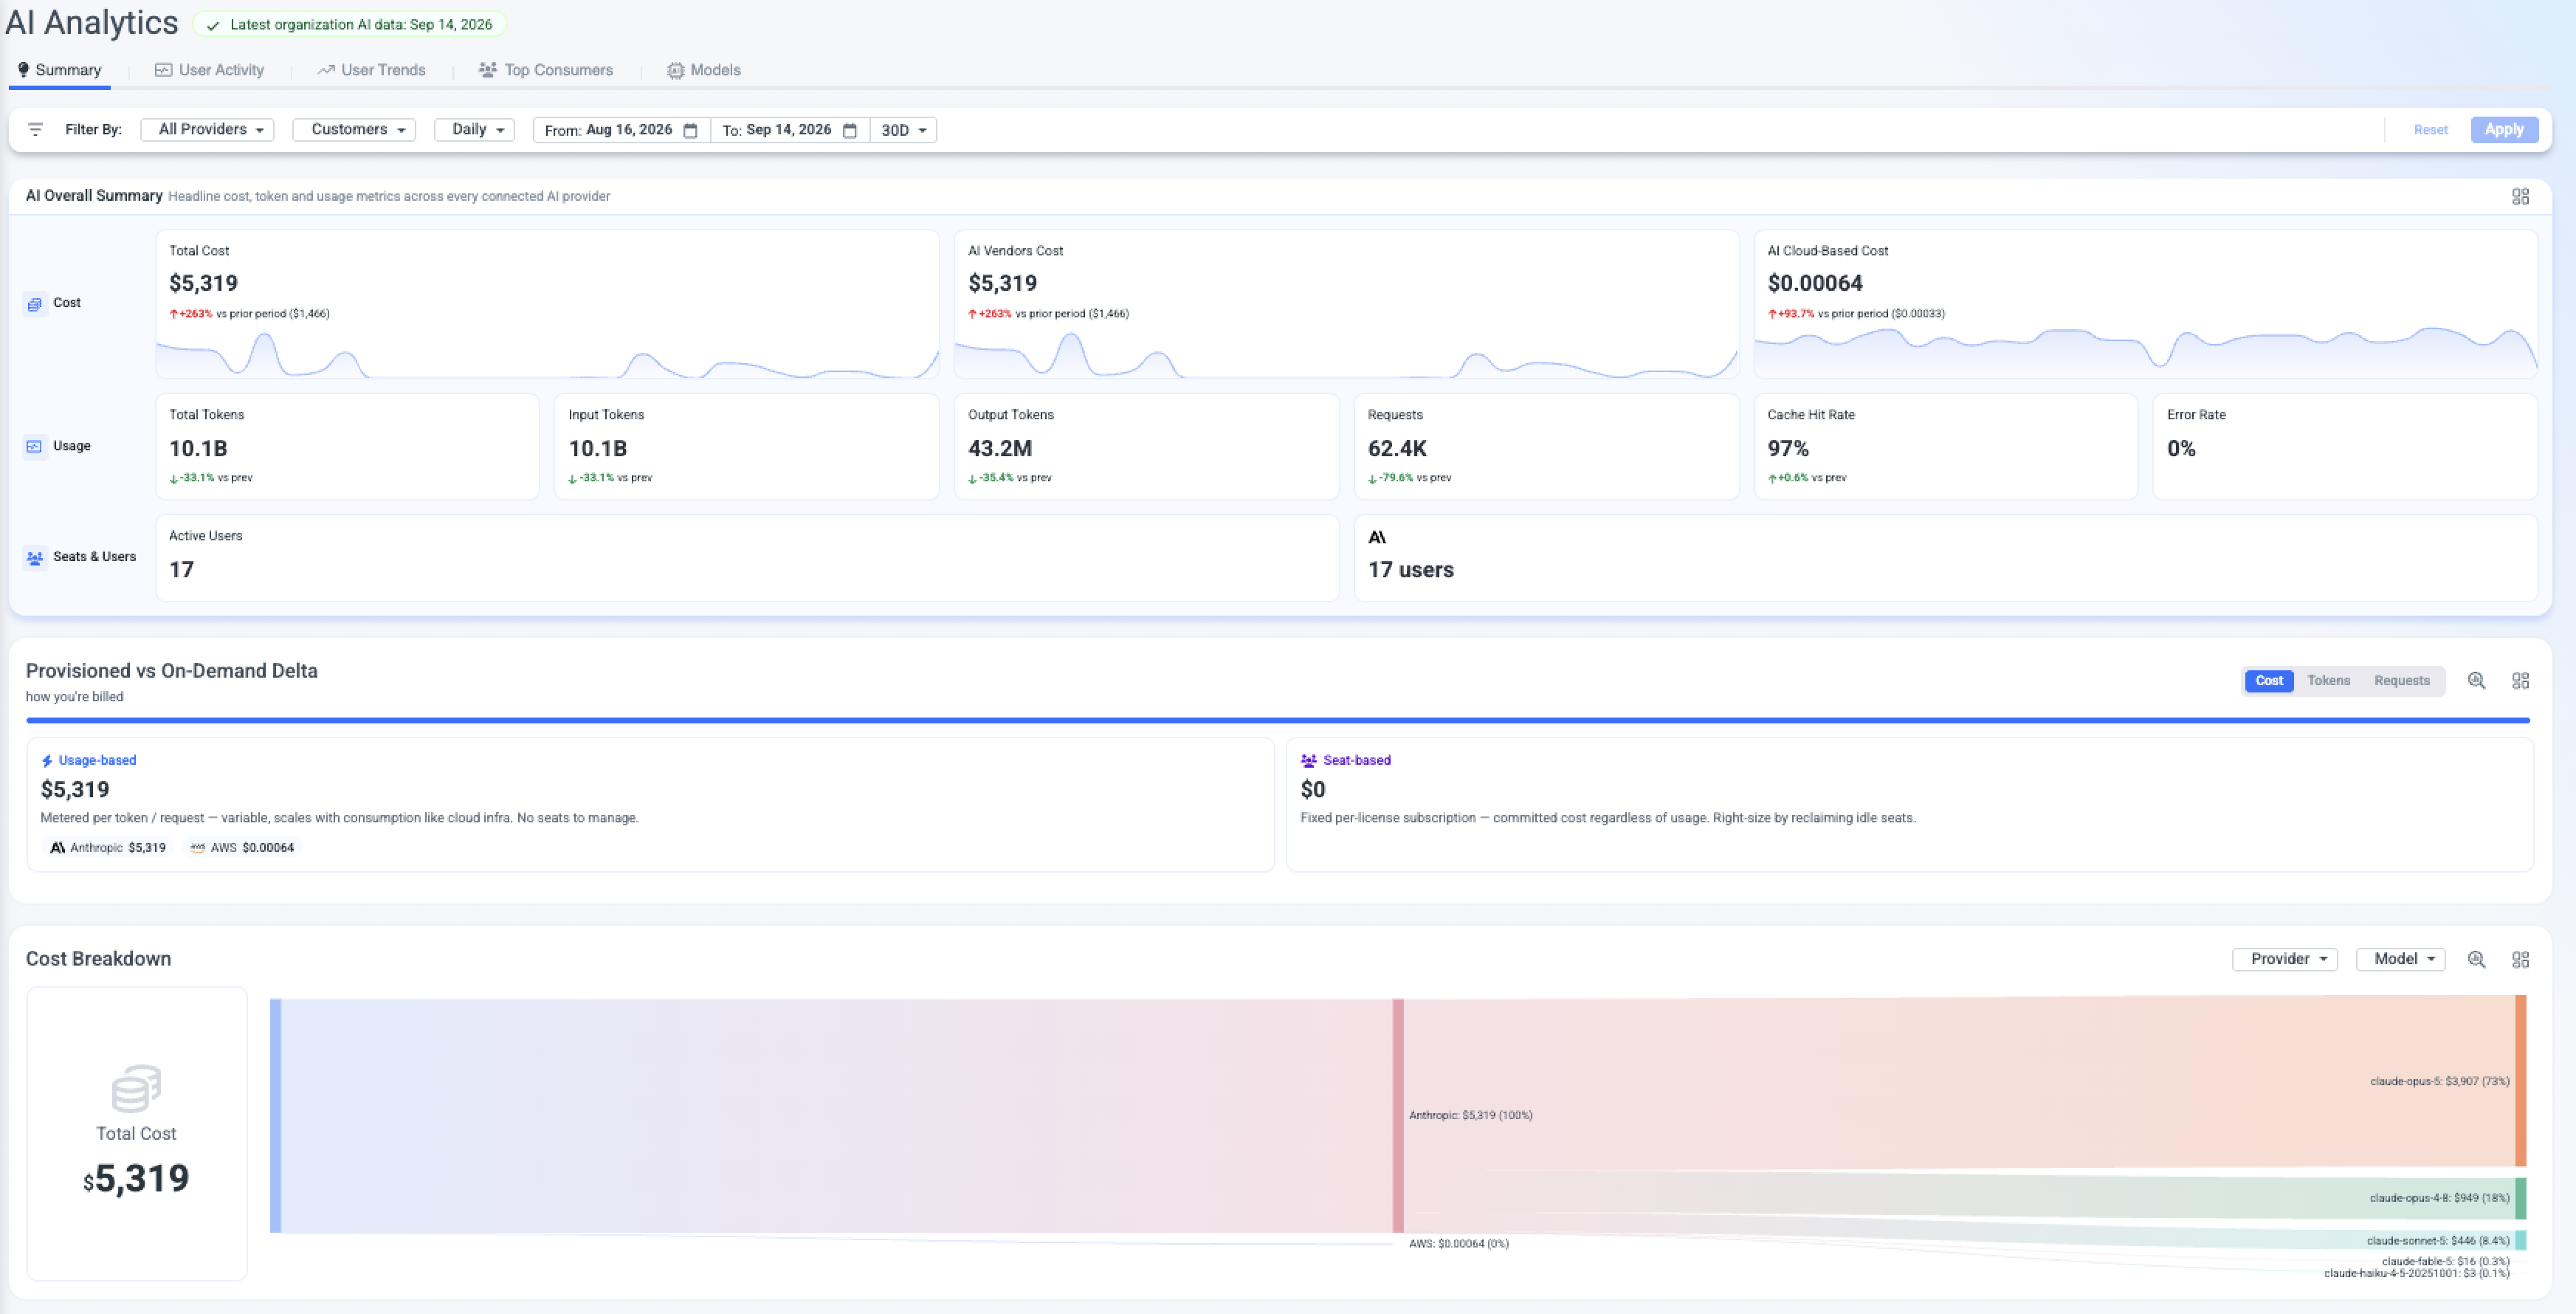
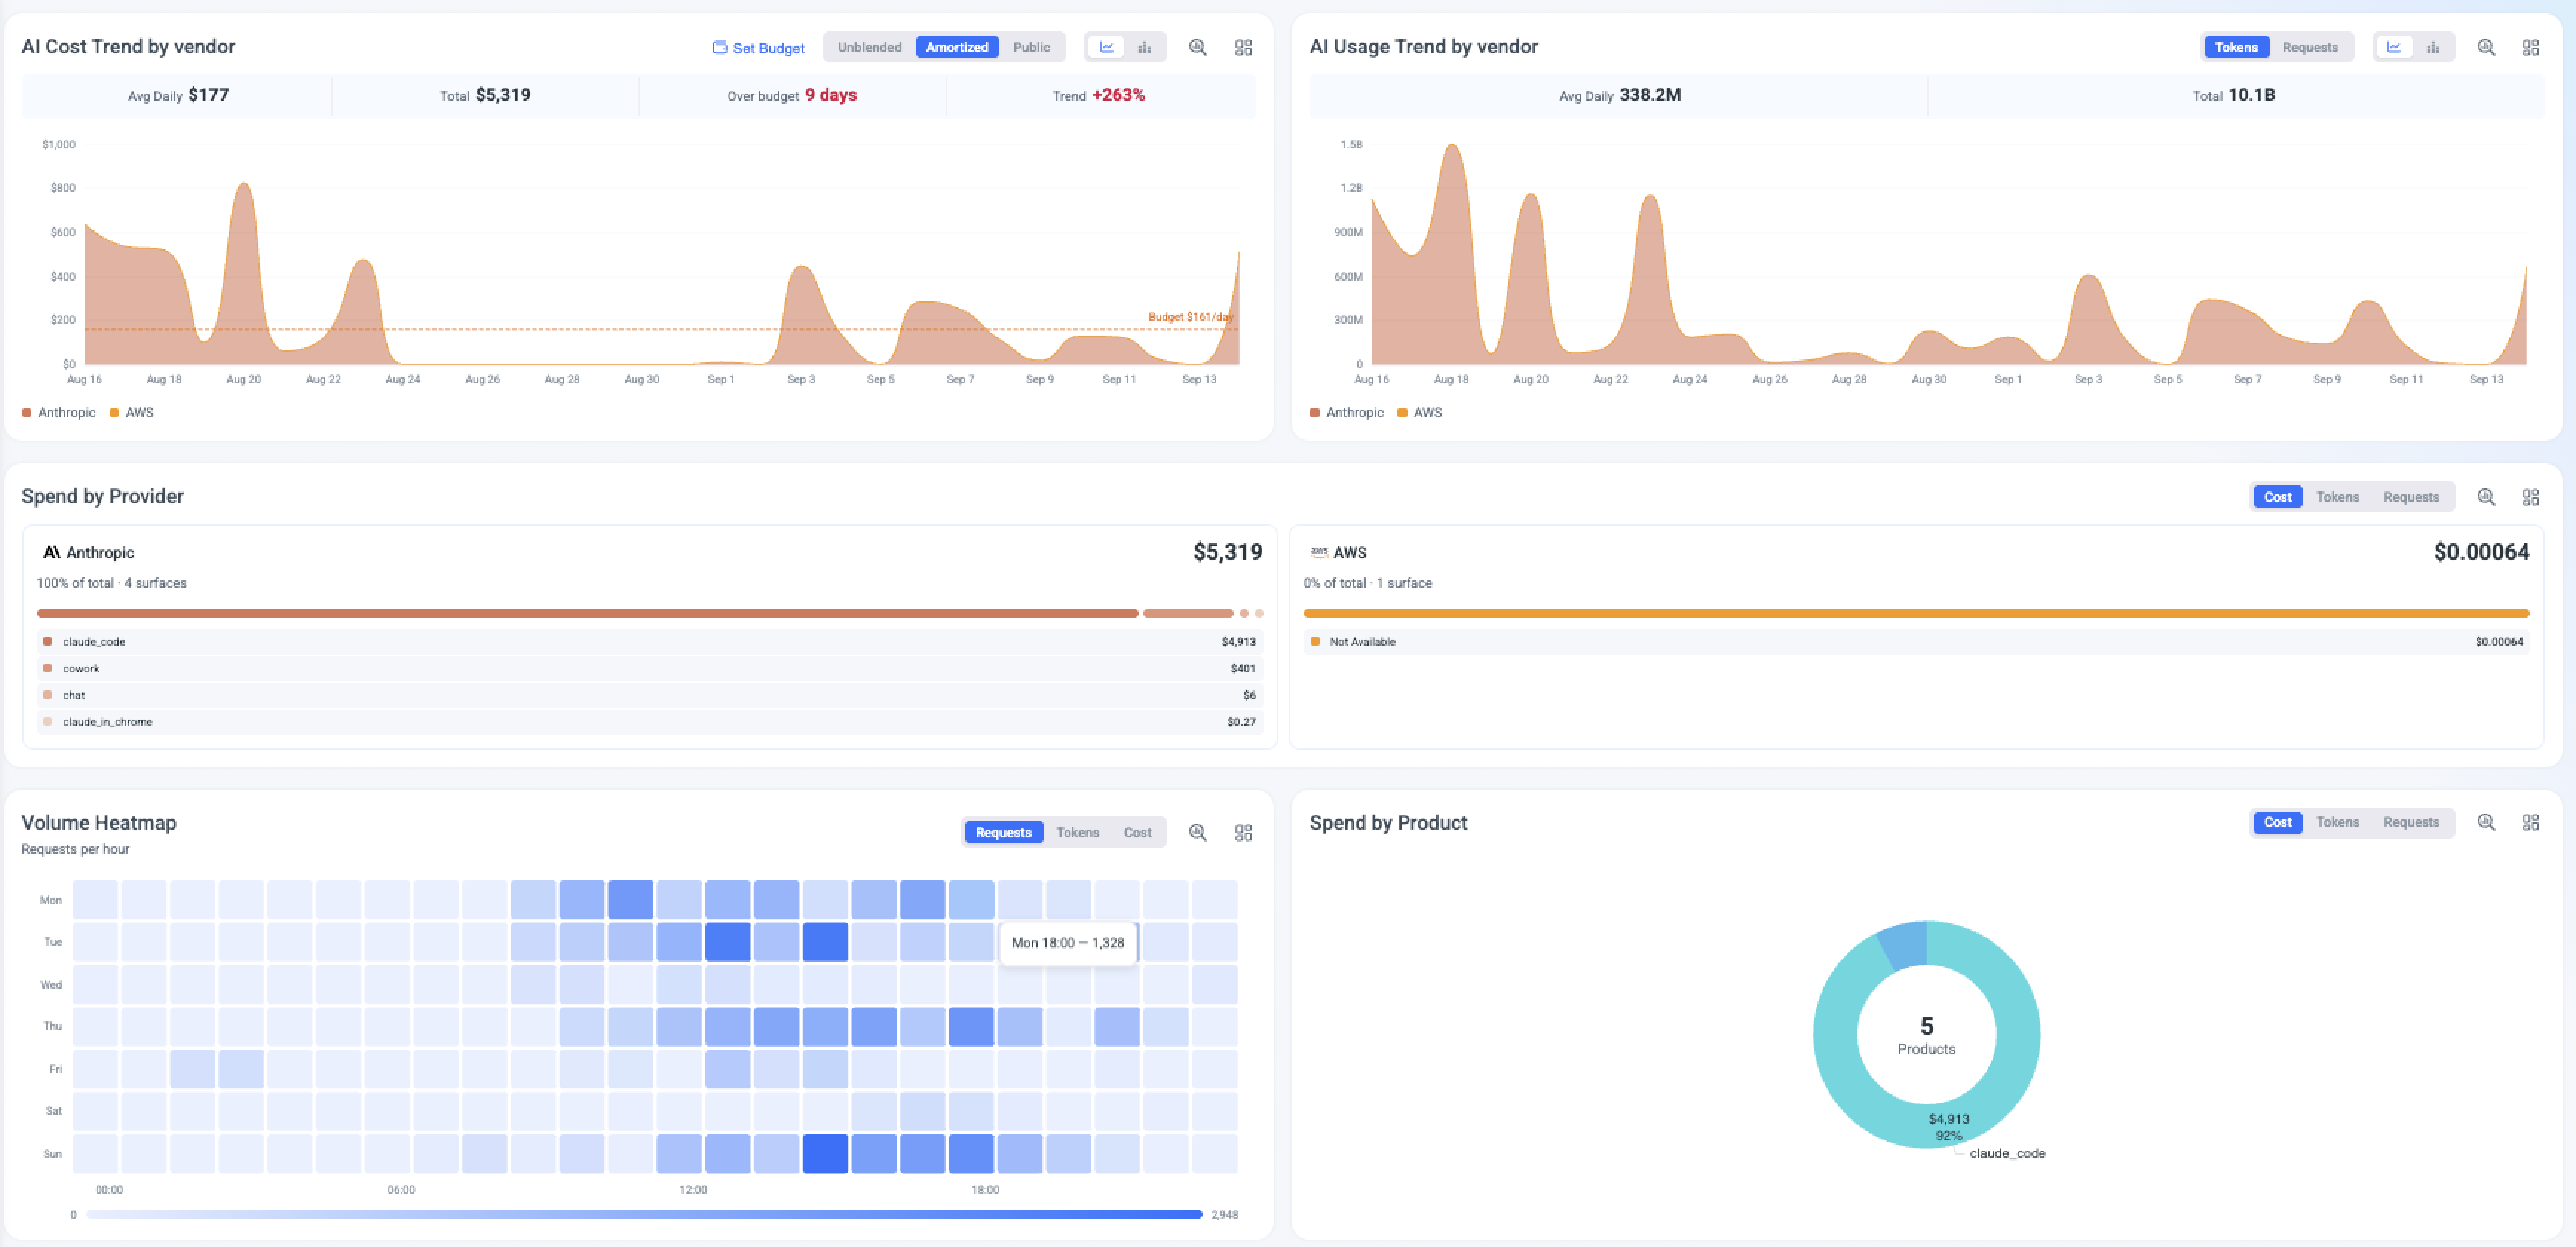
One top-level view of AI spend across every connected provider, with cost splits, budget tracking and a day-by-hour volume heatmap.
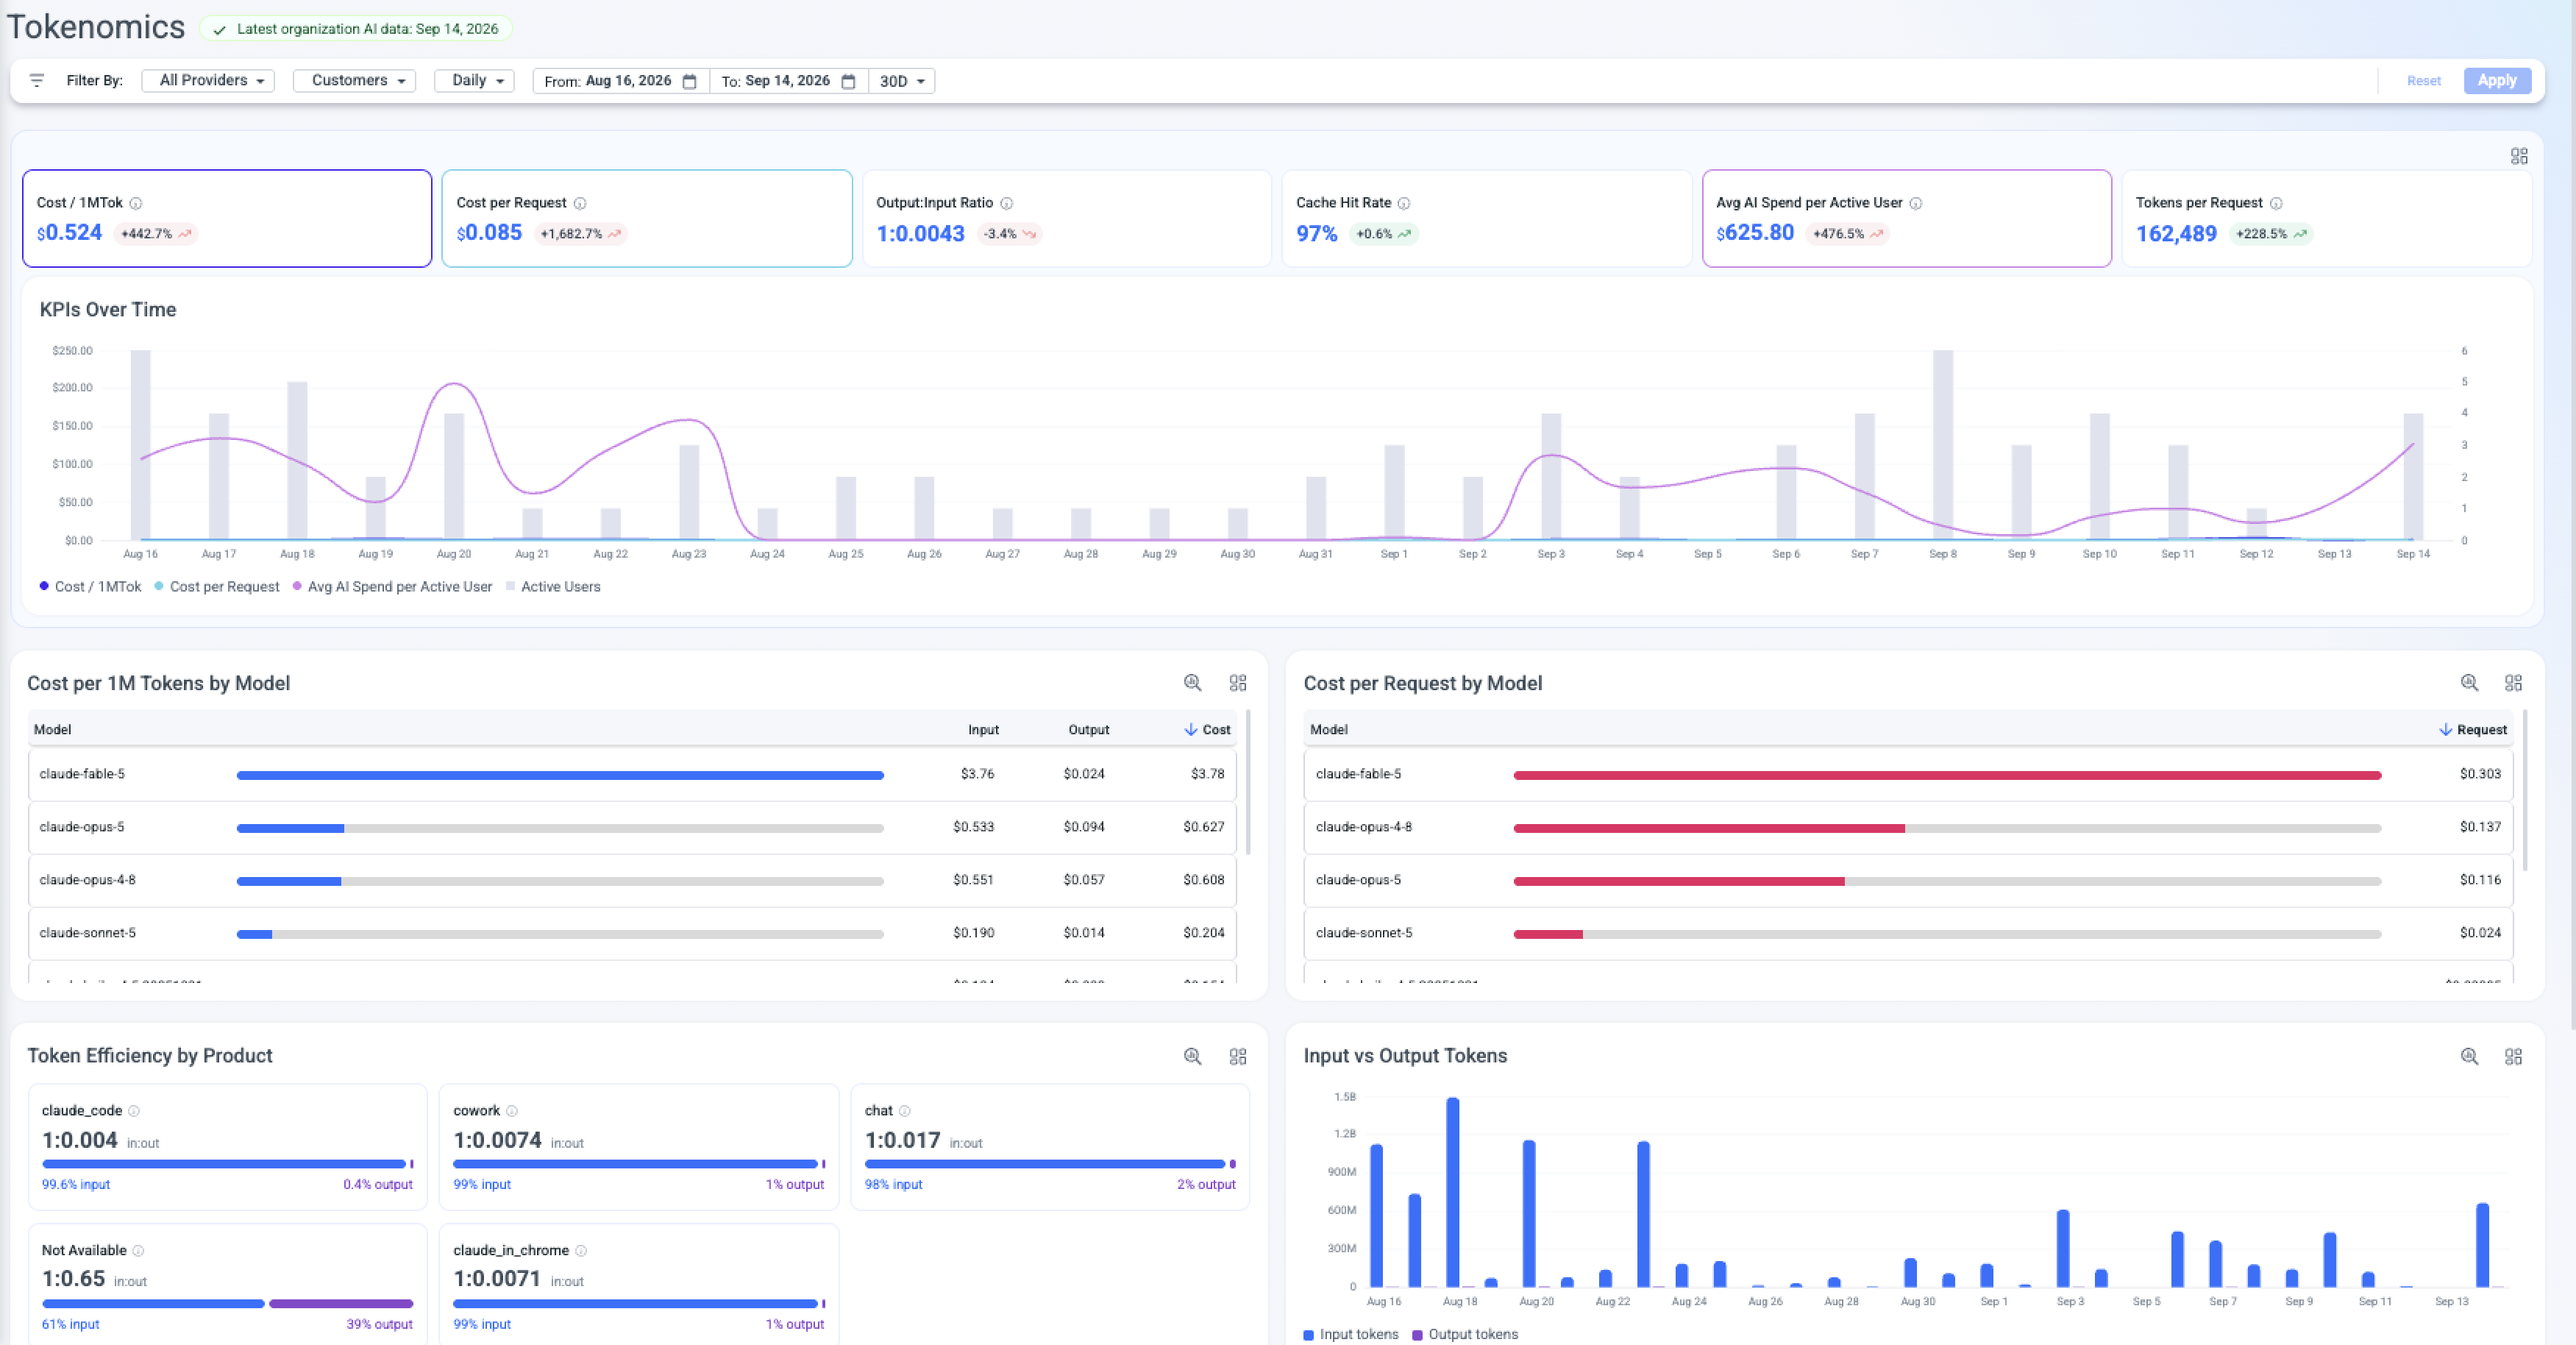
Unit economics automatically - cost per request, cost per million tokens, cache hit rate and output-to-input ratios by model and use case.
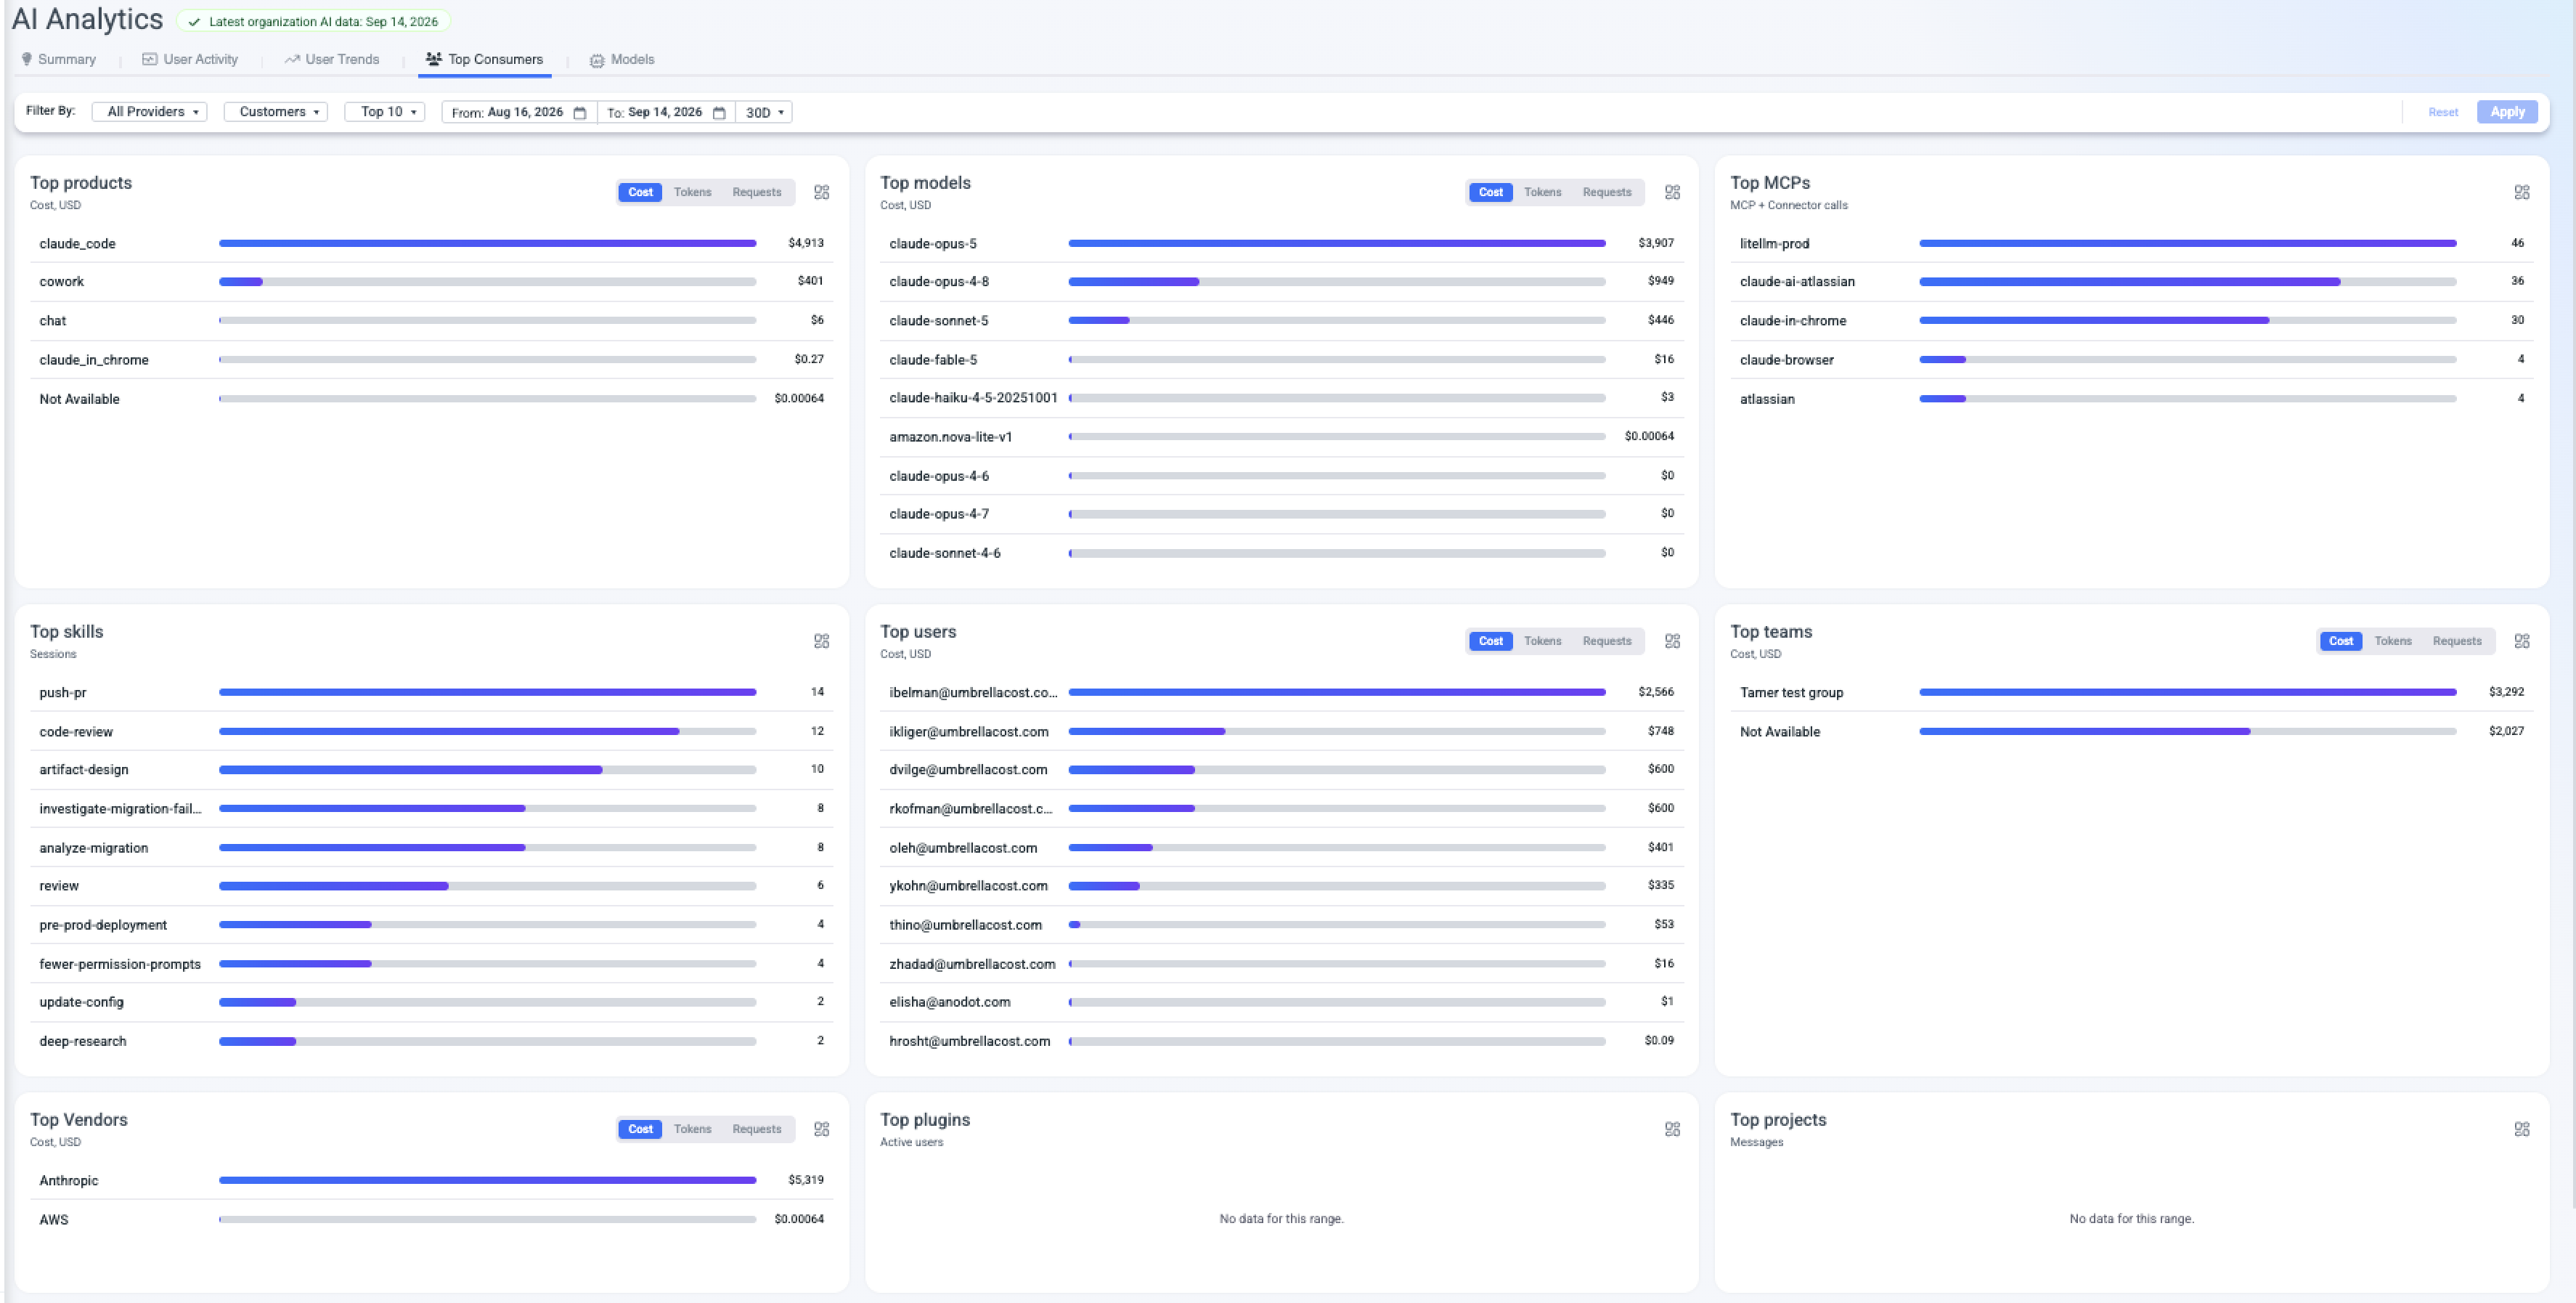
Rank the biggest consumers - users, teams and models - to pinpoint where cost concentrates and follow up with the right owner.
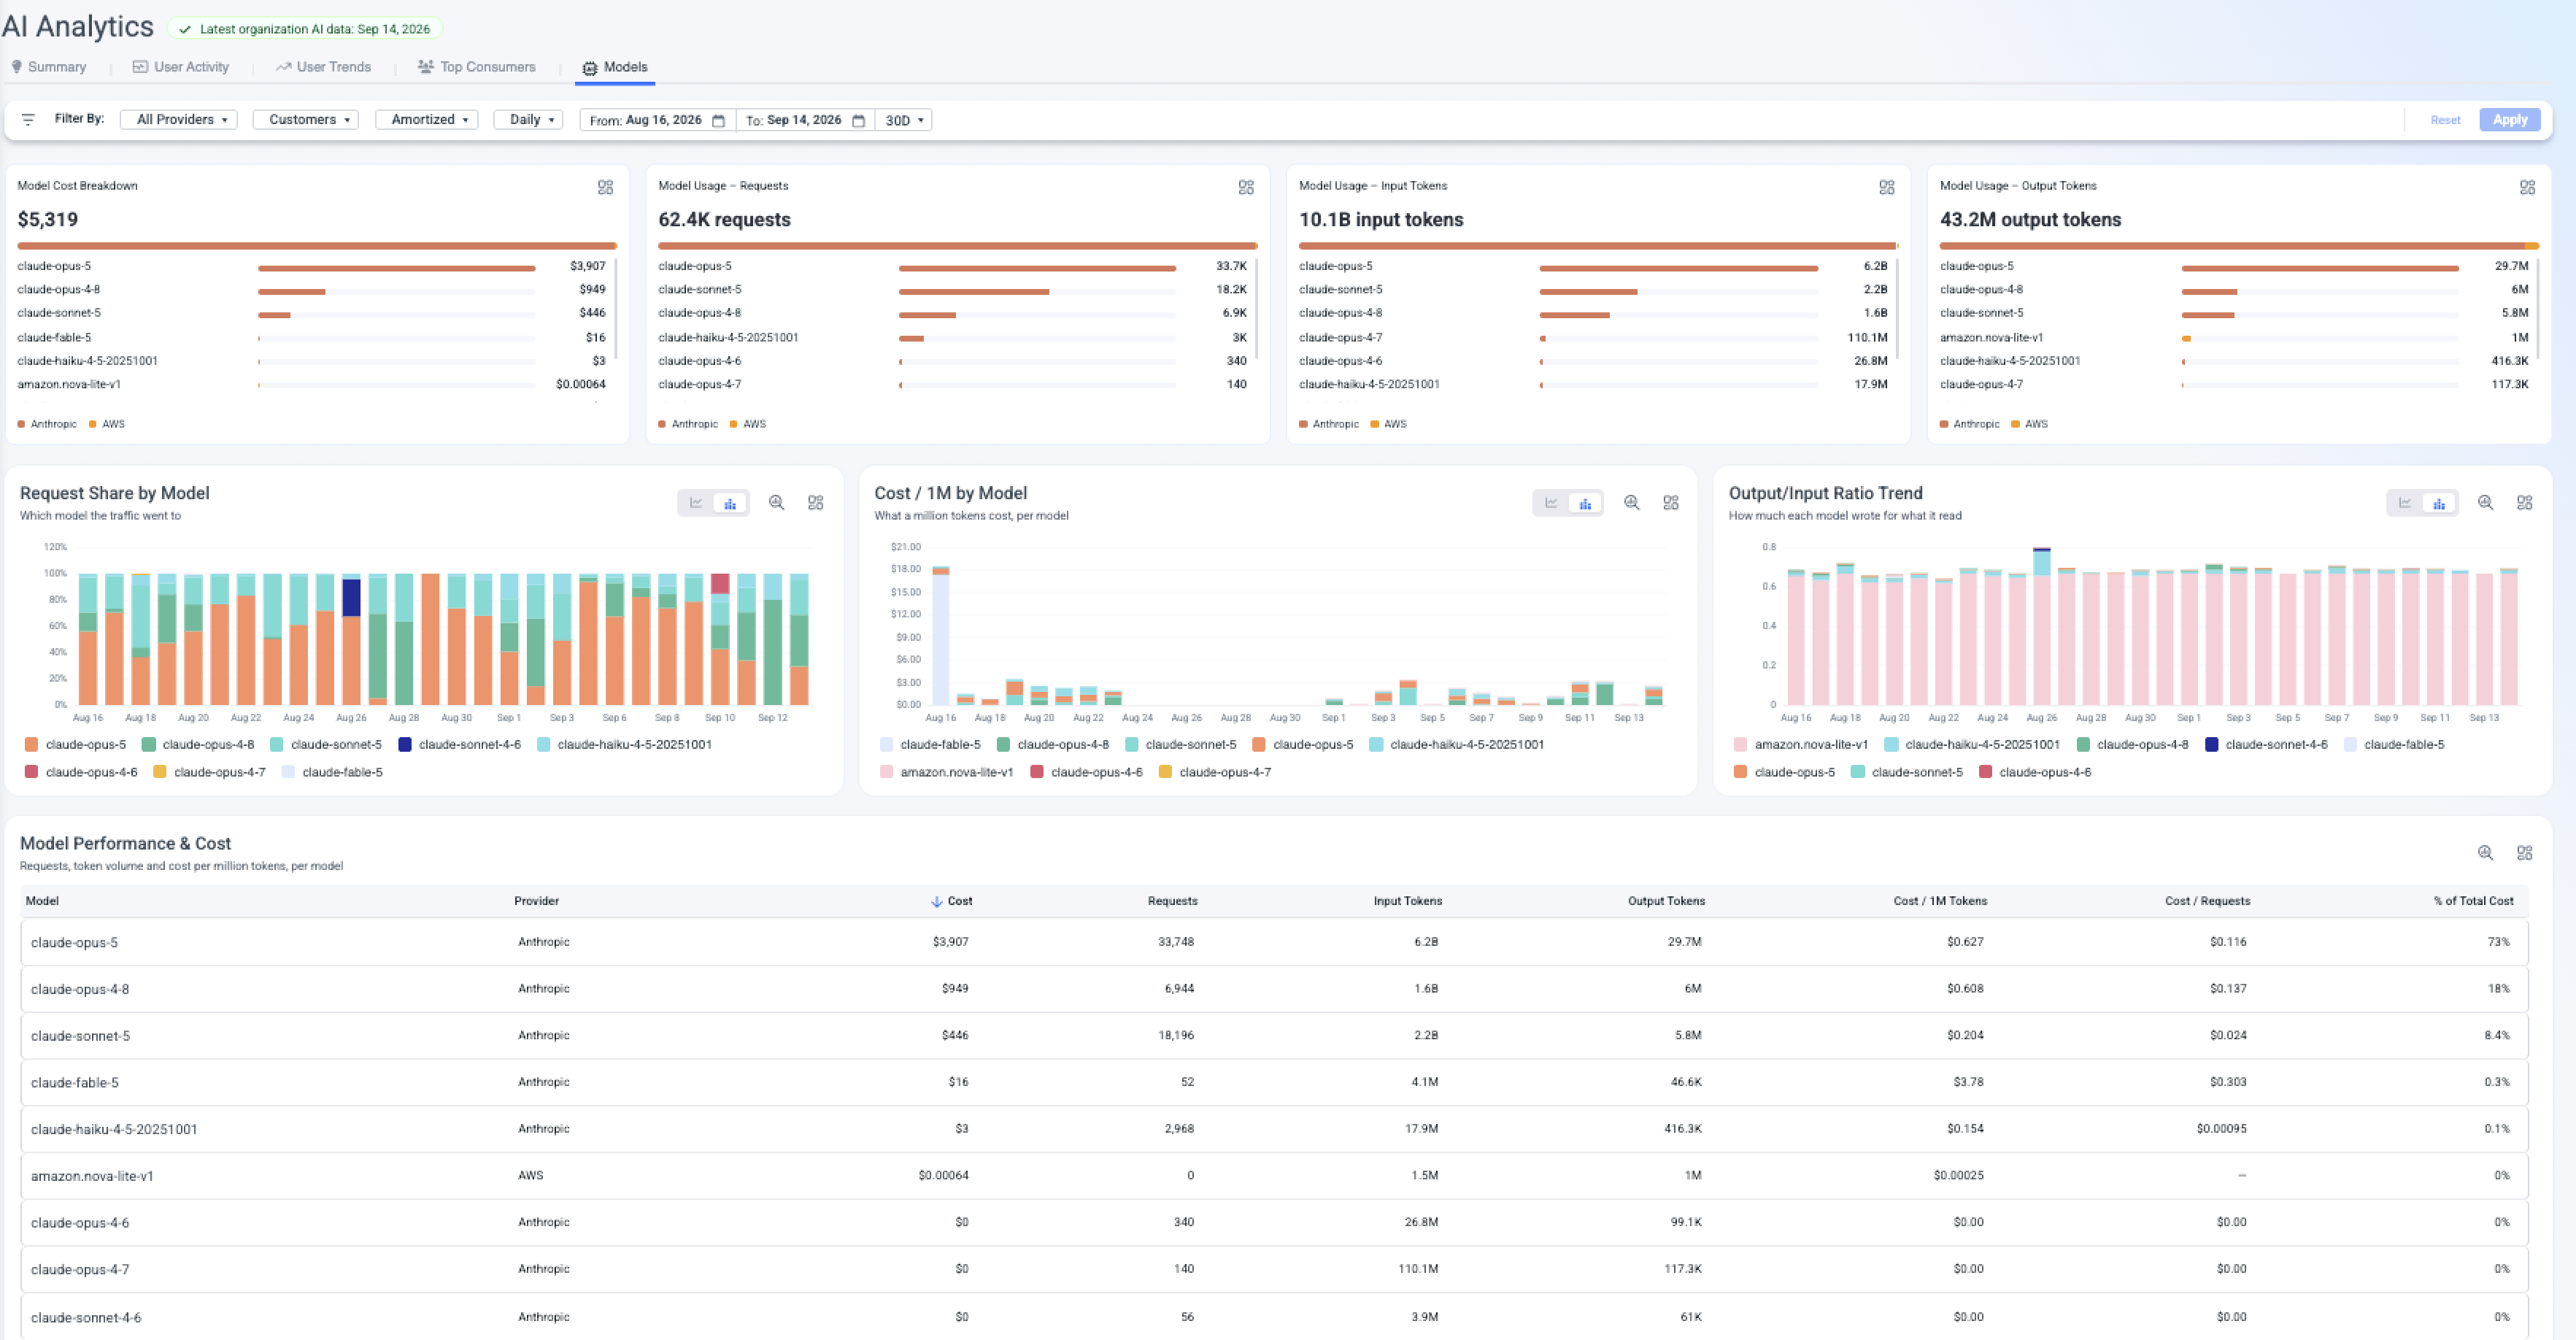
Compare models side by side - pricing, token volume and efficiency differences so you can route workloads to the right tier.
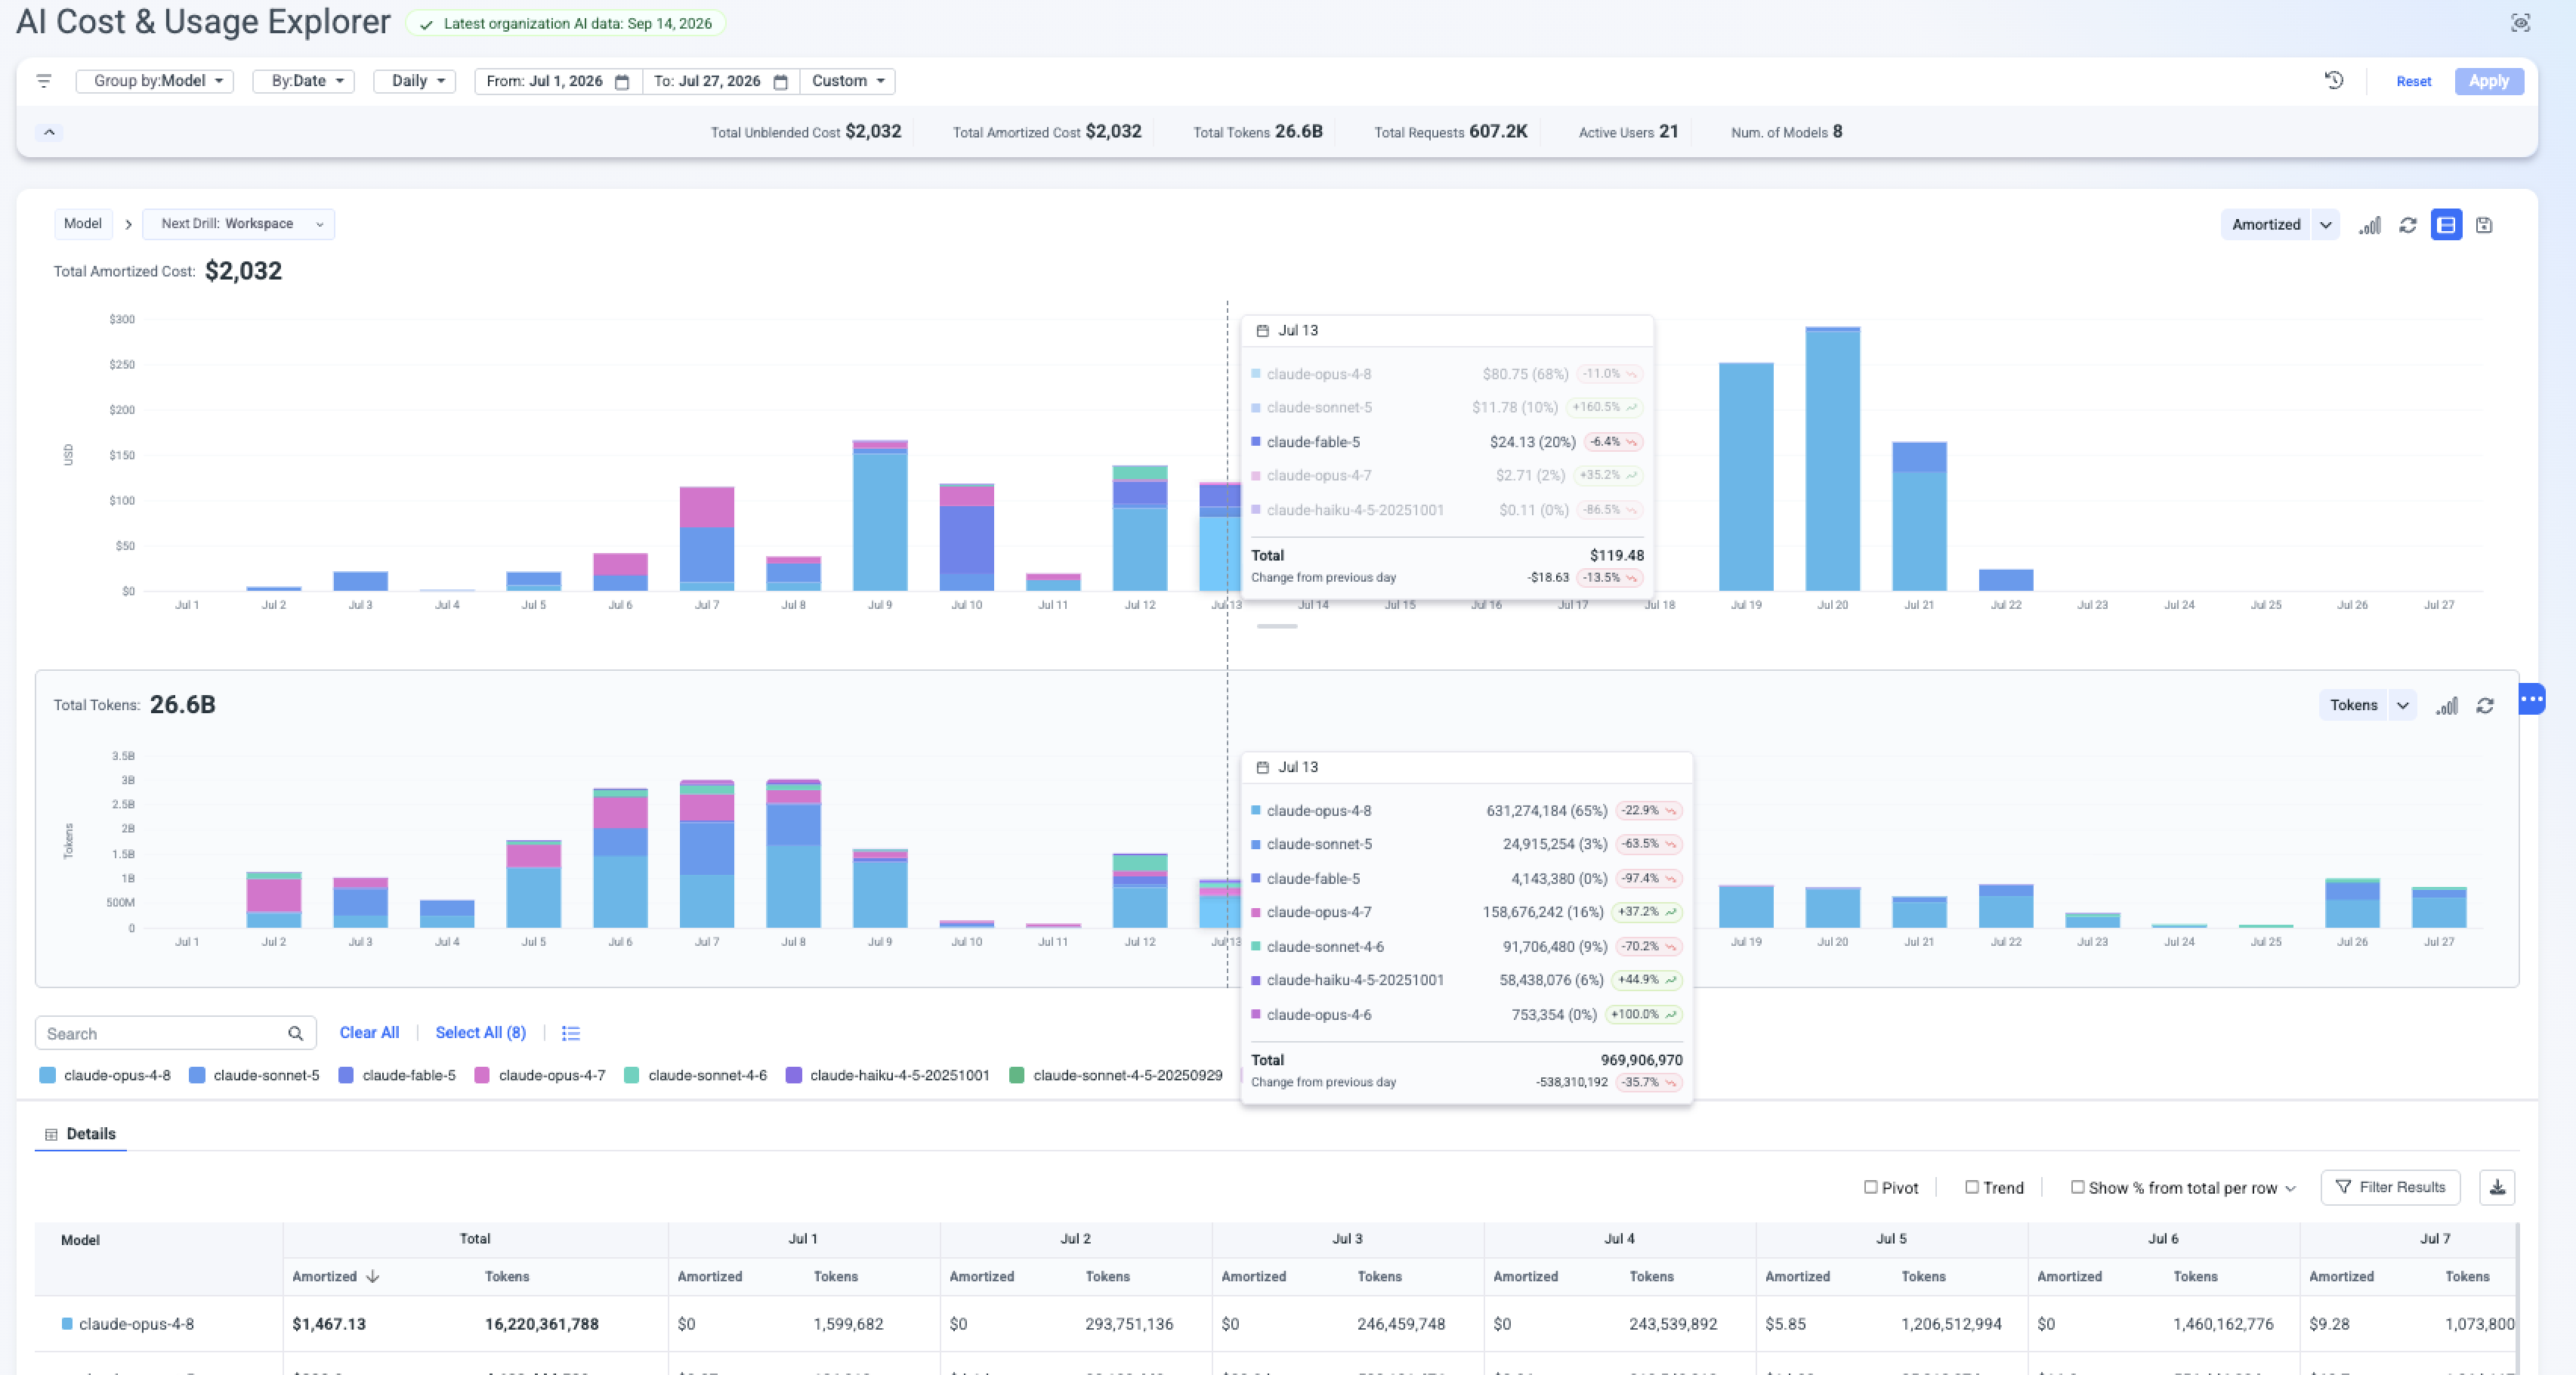
Investigate any spike with a chart and matching details table - group, filter and drill by model, user, team or workspace.
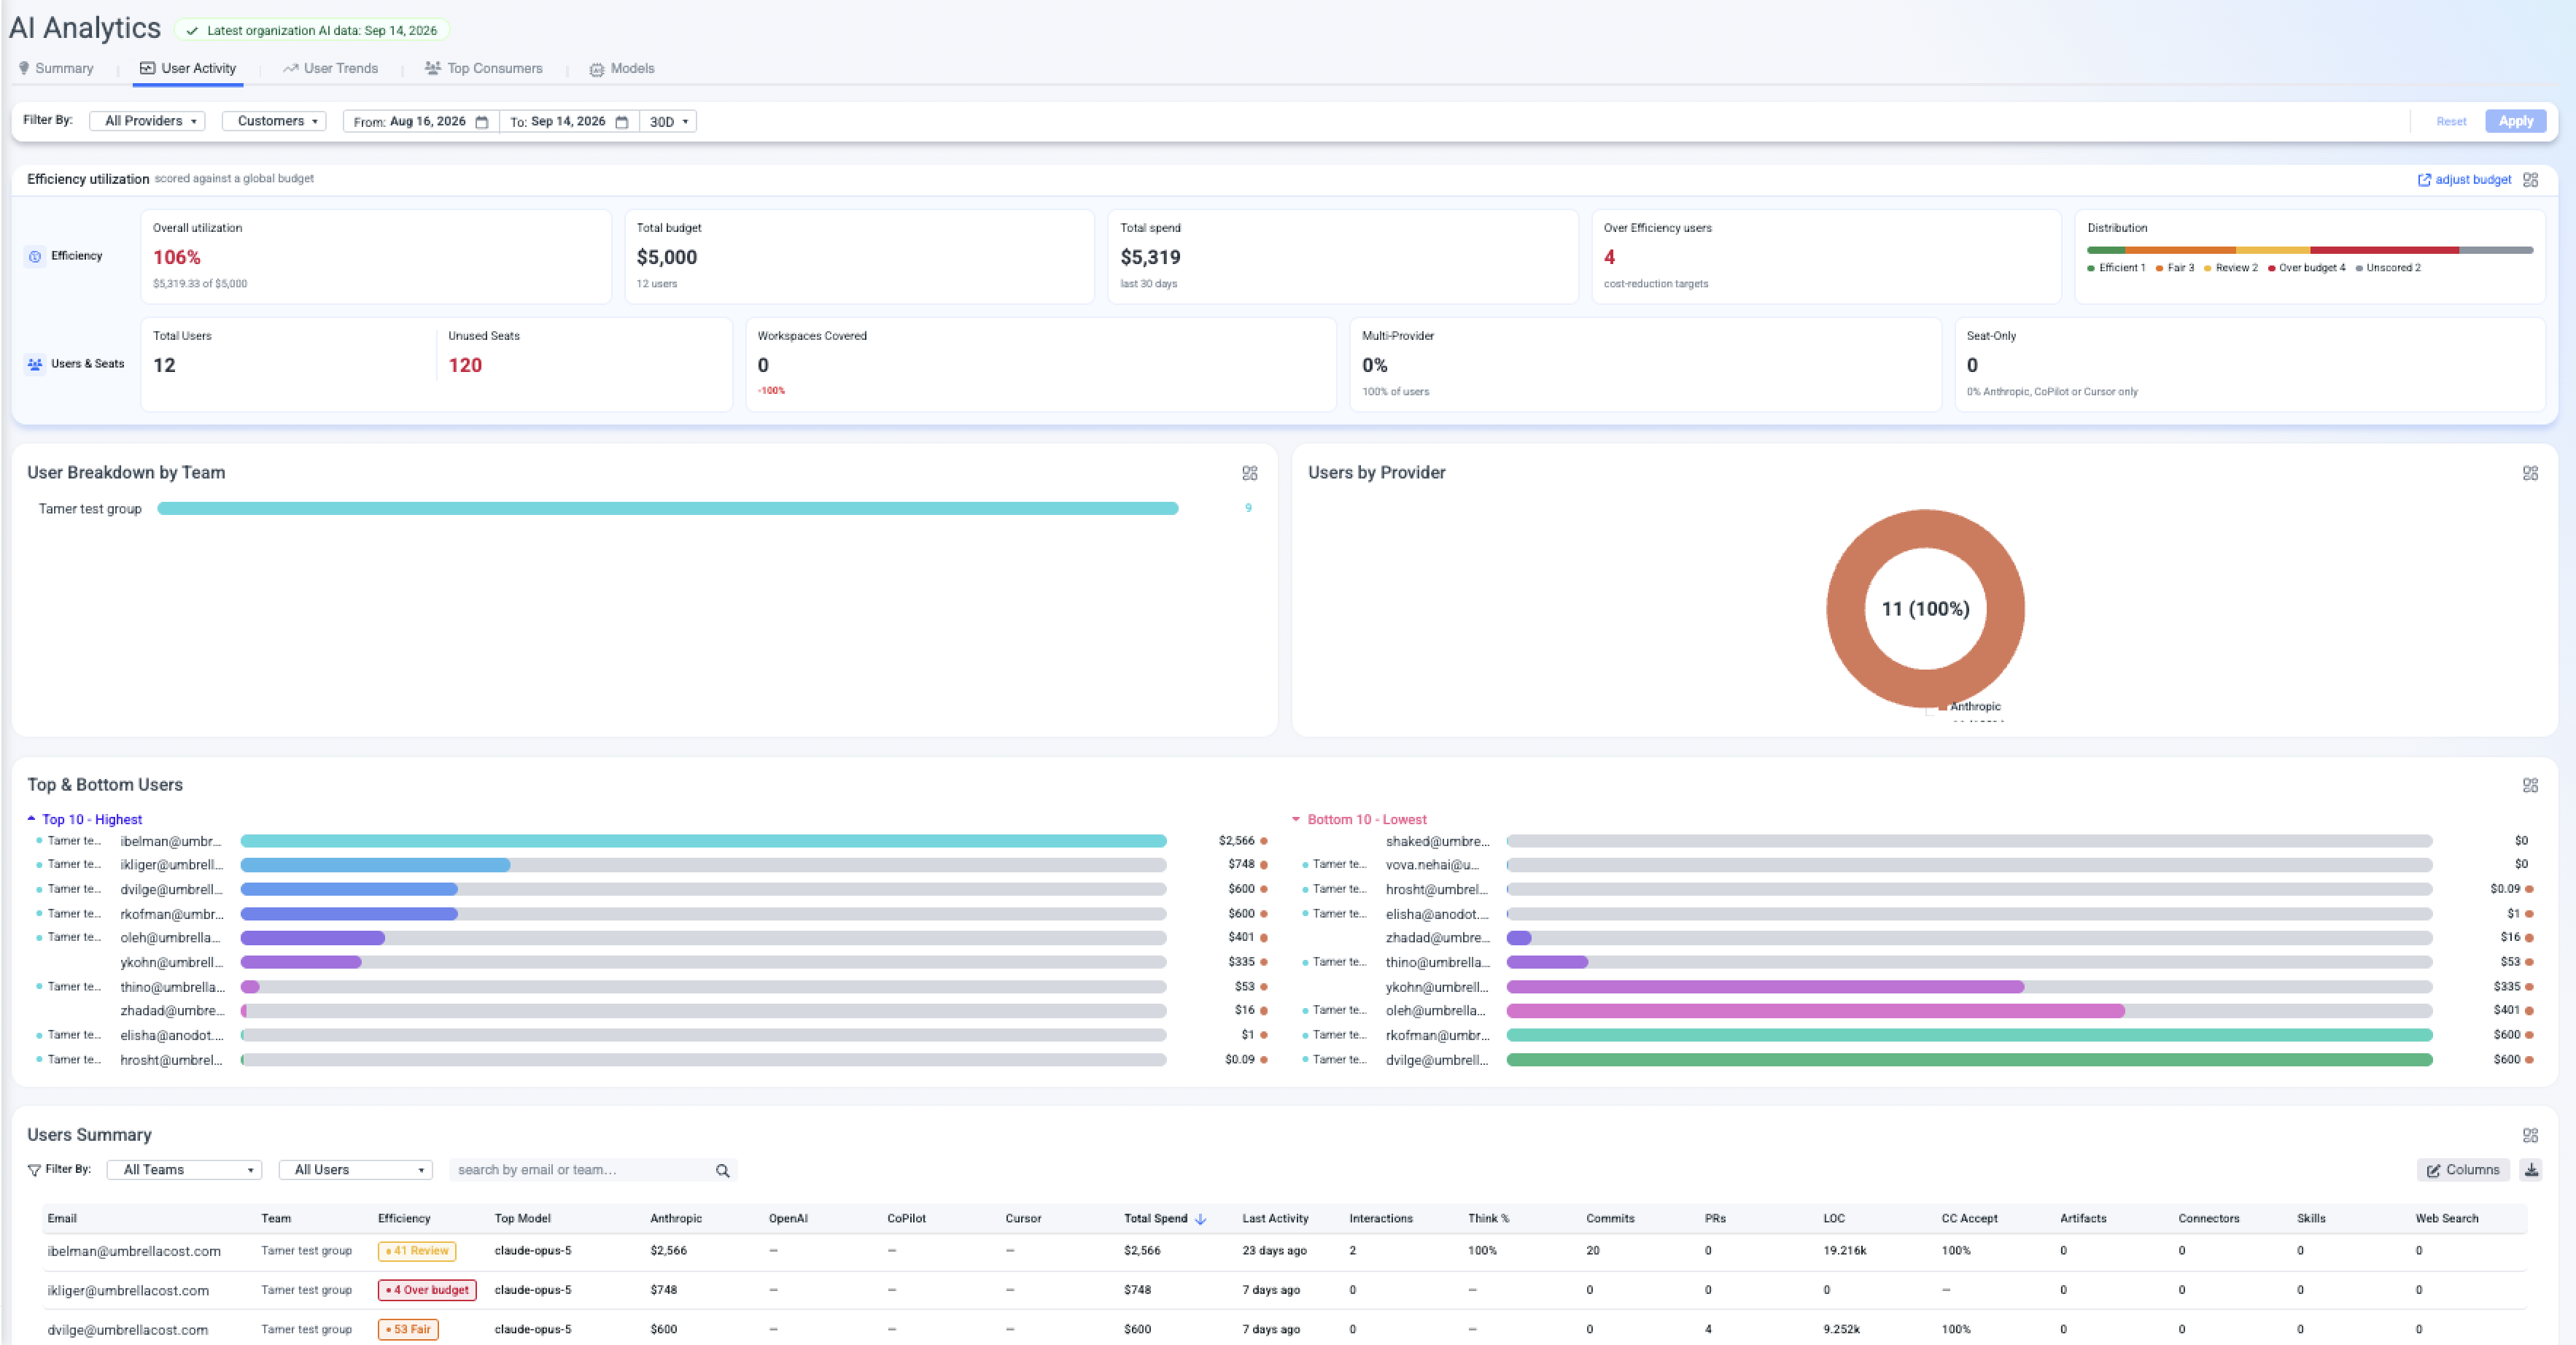
Track efficiency, utilization and per-user spend against budget - see which users are over budget and which seats are unused.
Allocate every dollar - map AI cost to customers, products, features or departments and expose unallocated spend.
Define AI KPIs from your own telemetry and allocate cost against them - cost per customer, per feature or per transaction.
Enrich users with team, department, role or cost center data and slice AI cost by any attribute that matters.
Automatically flag unexpected AI spend - Anthropic, AWS and GCP usage presented hourly, daily or weekly.
Control how user identities are handled - full attribution, anonymized pseudonyms, or discard at ingest - with role-based access.
See it in action
Analytics Summary
The AI Overall Summary shows cost, token and usage metrics across every connected provider. Cost and usage trends by vendor and product, with a day-by-hour volume heatmap.
Tokenomics
Cost per request, cost per million tokens, cache hit rate and output-to-input ratios, by model and use case.
Cost & Usage Explorer
A chart paired with a matching details table you can group, filter and drill by model, user, team or workspace.
Models
Cost, requests and efficiency compared side by side.
Top Consumers
The biggest products, models, users and teams by spend.
User Activity
Efficiency, utilization and per-user spend against budget.
Why it pays off
Catch overruns early - Budget lines and daily trends flag spending jumps before they compound into surprise invoices.
Cut the waste - Validate caching ROI, right-size model selection by workload, and reclaim idle seats before renewal.
Prove unit economics - Answer "is our AI spend efficient?" with cost per request, per token and per user - no custom metrics layer to build.
Charge back with confidence - Map every dollar to a customer, product or department to inform pricing, renewals and feature profitability.
Updated 9 minutes ago