Telemetry Pipeline Creation
Telemetry pipeline is how you bring measures (such as cpu_utilization_pct or customer requests) and their dimensions (such as Region or Service) into Umbrella. You set one up with a guided 5-step wizard. Once the pipeline is processing, you can build KPIs on its measures and use them across the platform.
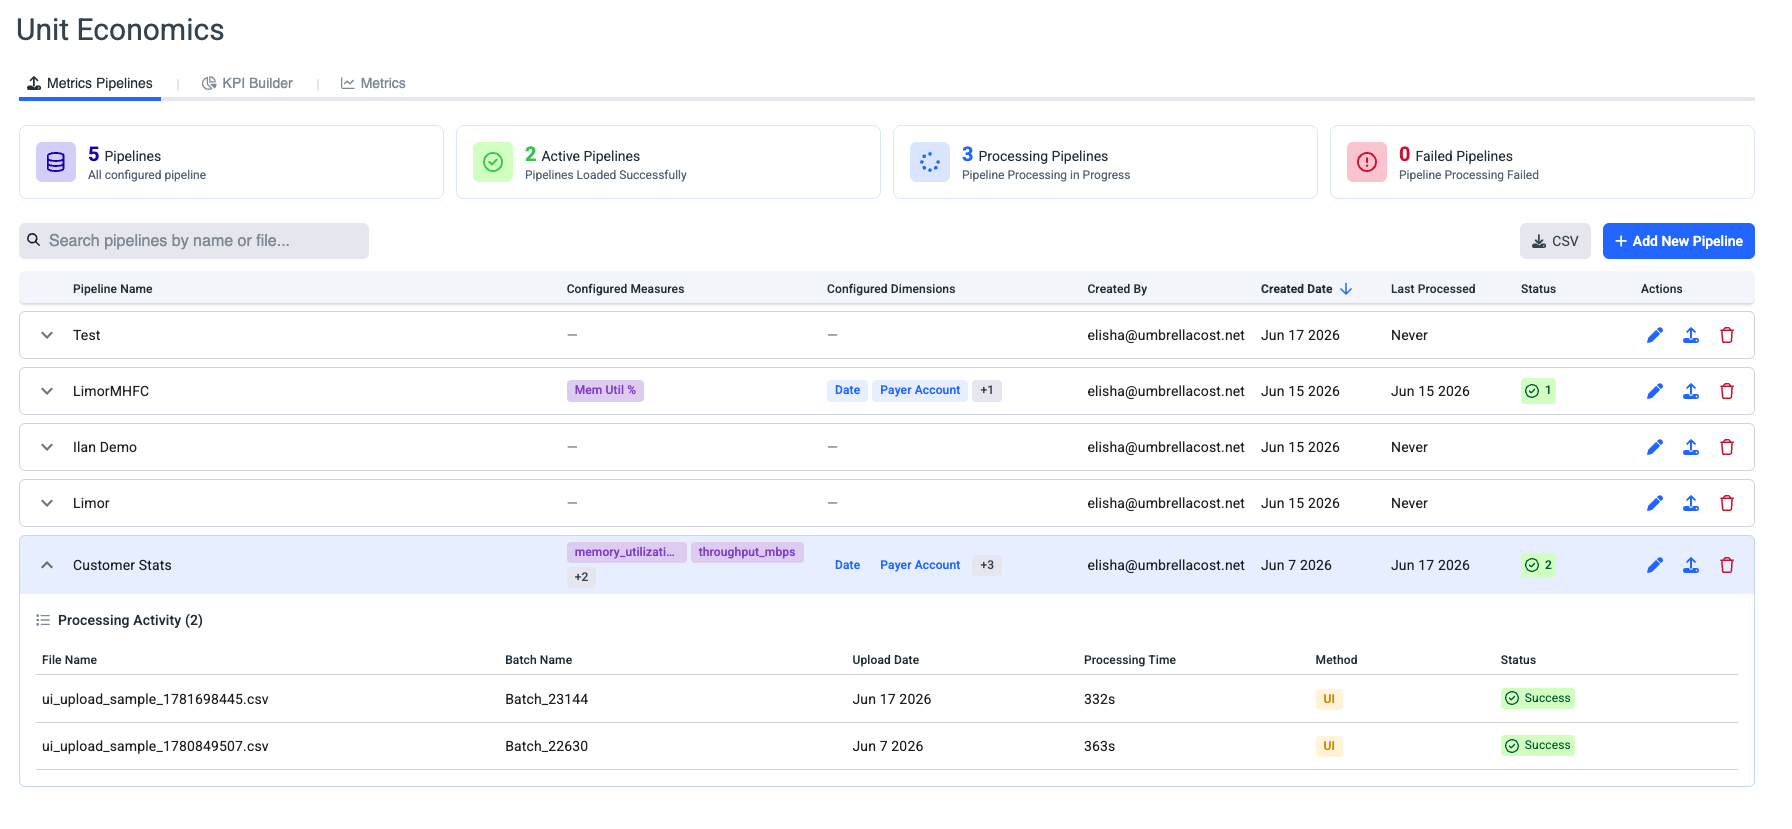
Start from the Metrics Pipelines tab of Unit Economics and click + Add New Pipeline.
The onboarding flow at a glance
| Step | What happens |
|---|---|
| 1. Get Started | Overview of the wizard and a few things to know before you begin. |
| 2. Upload & Config | Name the pipeline, copy your S3 bucket, retrieve an access key, and upload a sample CSV. |
| 3. Review & Mapping | Preview the file and map each column to a role. Umbrella suggests mappings for you. |
| 4. Measure Config | Define your measures, set an aggregation for each, and assign units. |
| 5. Summary | Review everything, validate, and start processing. |
Good to know before you start
- Each pipeline supports a maximum of 5 measures.
- Each pipeline supports a maximum of 5 dimensions.
- After pipeline creation, you can load data via the UI or S3 file load.
- Pipeline name, dimension mapping, and measure display names can all be edited later.
Best practice is to periodically upload files to S3
Step 1: Get Started
The first screen summarizes what the wizard will walk you through. Review it, then click Get Started.
Step 2: Upload & Configuration
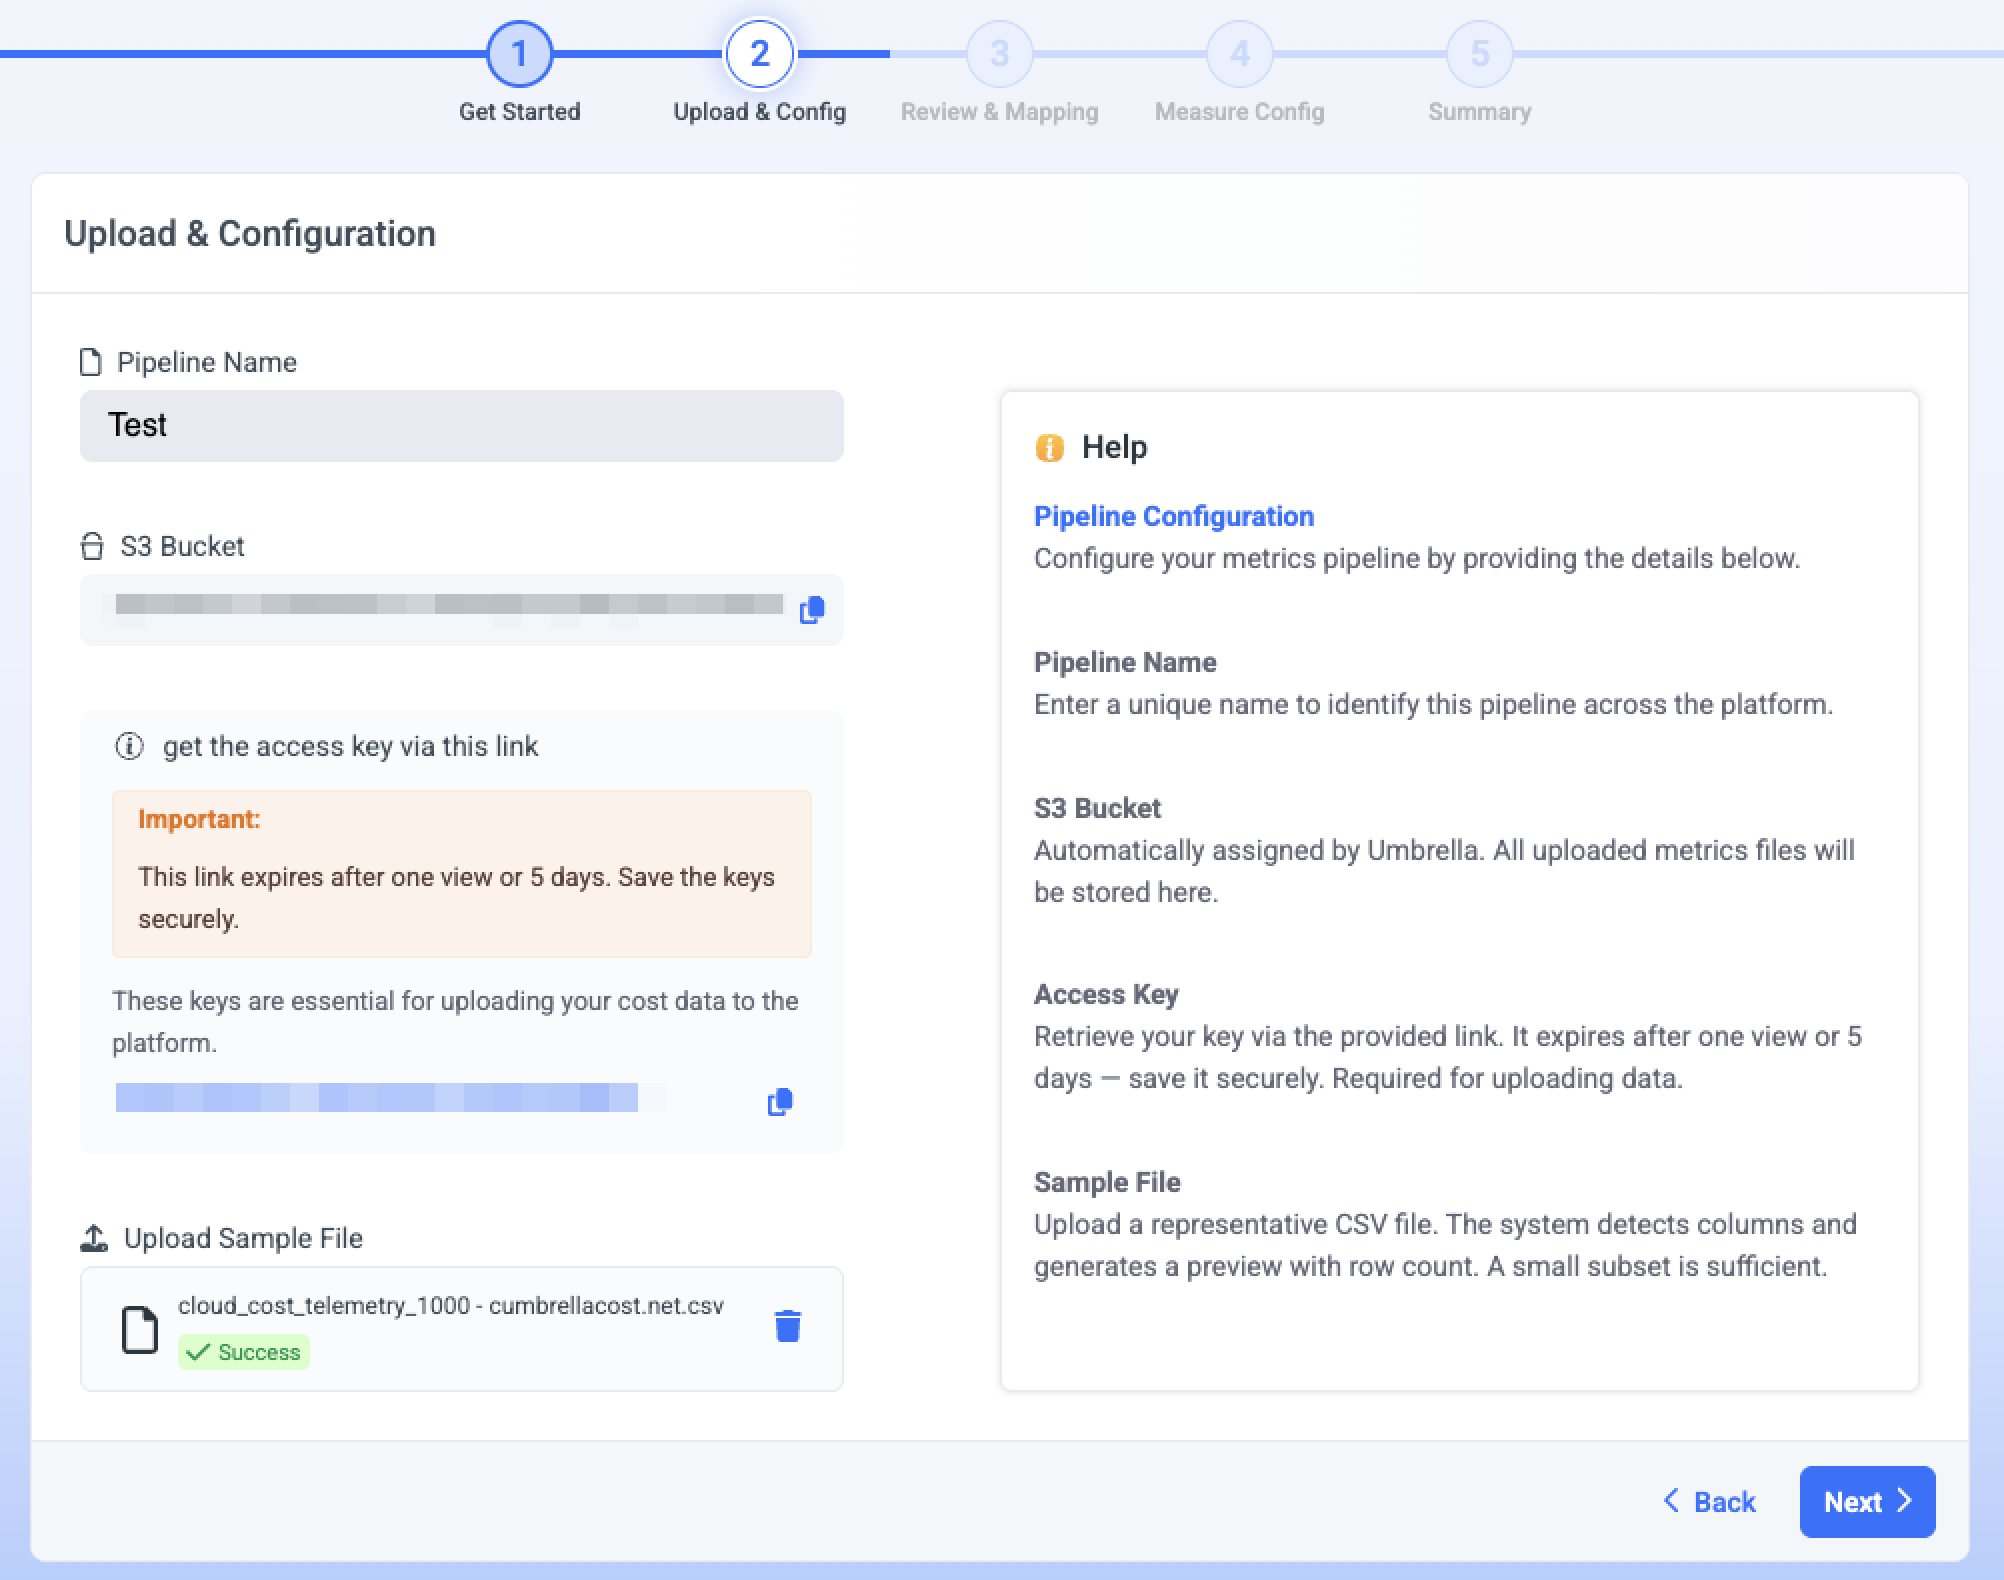
- Enter a Pipeline Name - a unique name that identifies this pipeline across the platform.
- Umbrella generates an S3 bucket where all uploaded metrics files are stored for periodic uploads.
S3 Bucket
Your S3 Bucket is automatically assigned by Umbrella. All uploaded metrics files are stored here. Use the copy icon if you need it for periodic uploads.

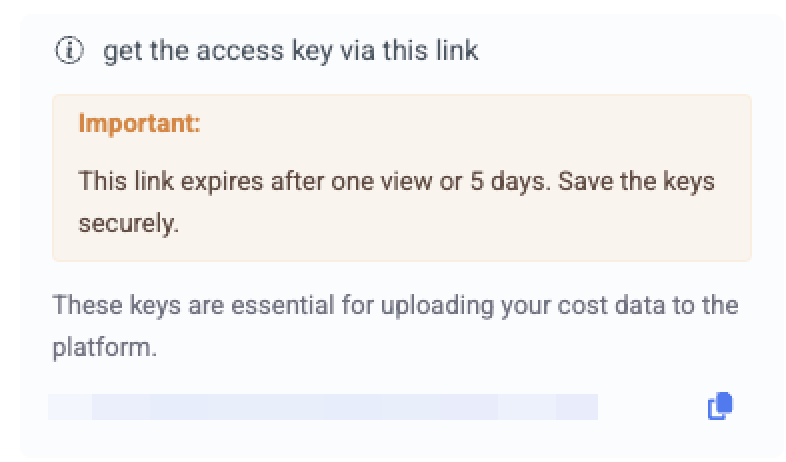
- Retrieve your Access Key using the get the access key via this link link.
Save your access key immediately
The access-key link expires after one view or 5 days. Save the key somewhere secure - it's required for uploading data, and you can't view it again afterward.
- Under Upload Sample File, click or drag a representative CSV. Umbrella detects the columns and generates a preview with a row count.
Samle File Prerequisite
- Umbrella only needs it to detect columns and preview the data; you don't upload your full dataset here.
- Files can contain up to 1,000 rows.
- Click Next.
Step 3: Review & Mapping
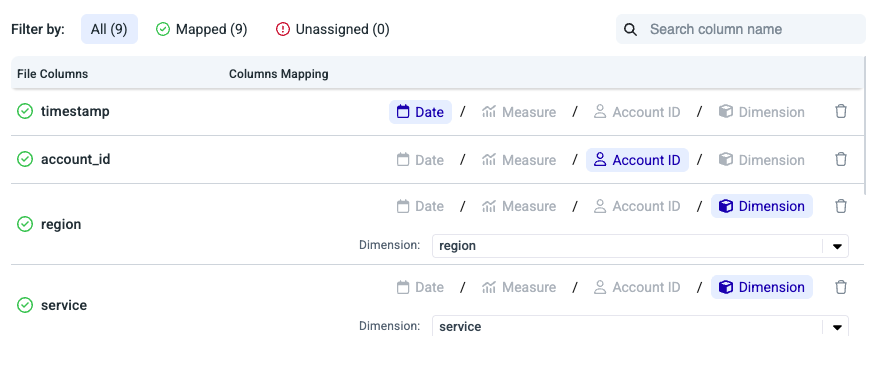
Umbrella displays a File Preview (including sample rows and detected row and column counts) to help you confirm the file was parsed correctly. You can then map each column to a pipeline role: Date, Account ID, Measure, or Dimension (Cloud/Custom Dimension).
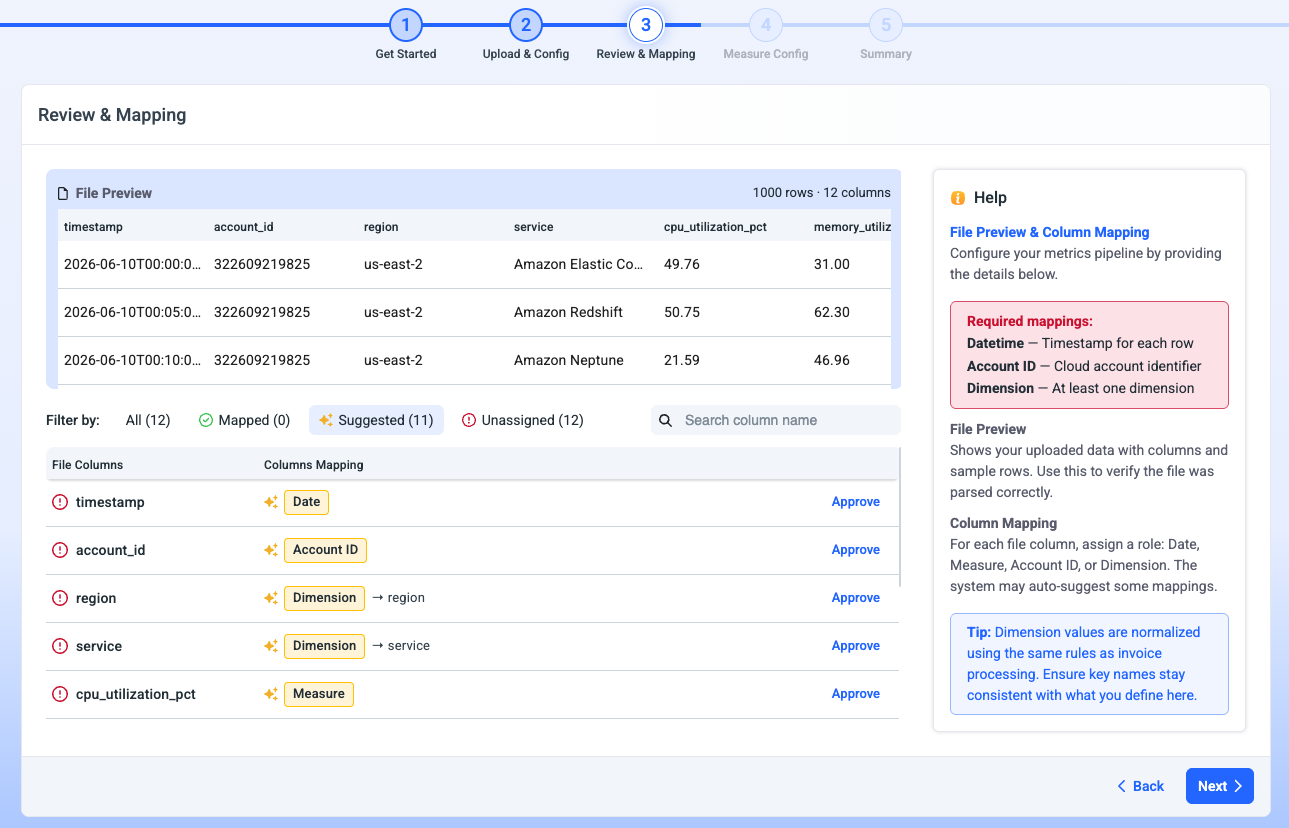
Required mappings4 mappings are mandatory:
- Datetime: The timestamp for each row.
- Account ID: The cloud account identifier corresponding to the injected measure/dimension.
- Dimension: At least one dimension and up to 5 in the same pipeline.
- Measures: At least one measure and up to 5 in the same pipeline.
Some input columns can remain unmapped.
Filter By
- All: View and map all input columns.
- Mapped: View columns that have already been mapped.
- AI-suggested mappings: Umbrella automatically suggests a role for each column (marked with a ✨ icon and grouped under Suggested). Approve the suggestion to accept it as-is, or map it manually.
- Unassigned: View columns that are not yet mapped.
Dimension Value Mapping RequirementsThe pipeline data mapped to Region, Family Type, and Services dimension values must match Umbrella’s predefined values. Below is the list of values used to match cost data.
Custom DimensionA custom dimension is a user-defined dimension that can be created and mapped via the pipeline. It is not part of the billing data and will be displayed in Cost & Usage Explorer, Assets, and Business Mapping.
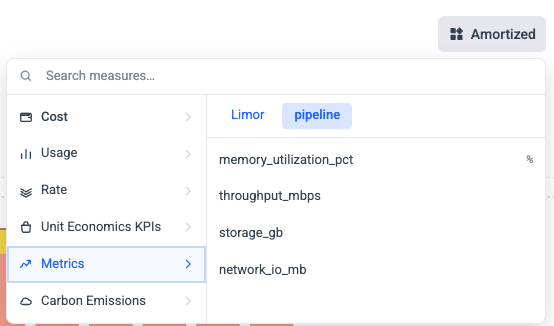
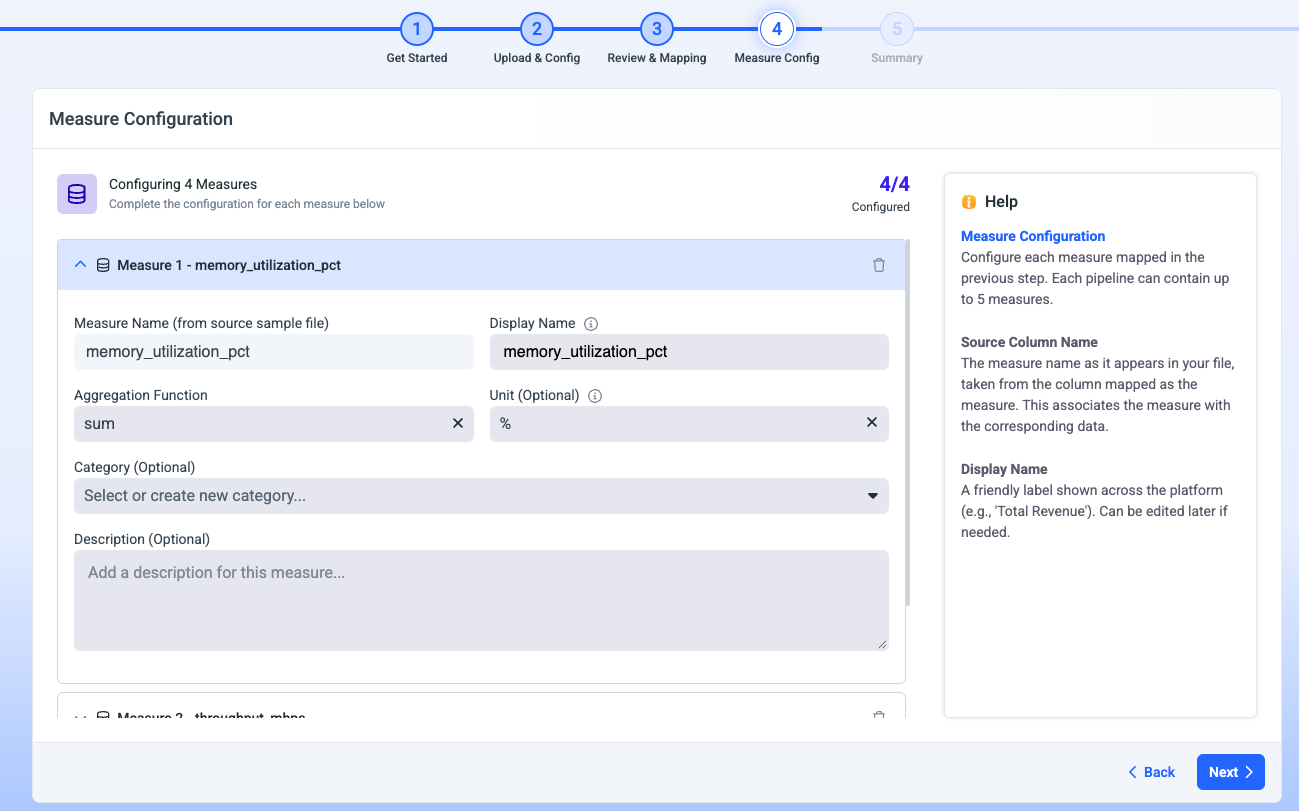
Step 4: Measure Config
Define your measures - the numeric values you're tracking (for example, throughput_mbps, storage_gb, Memory_util). For each measure, set an aggregation function (Sum, Average, Min, or Max) and assign a unit. You can configure up to 5 measures per pipeline. Click Next.
The aggregation function is mandatory as it is used for data rollup in Cost & Usage Explorer/Assets.
Category is used to create different folders in Cost & Usage Explorer that organize your injected measures.
Step 5: Summary
- Review the full configuration - pipeline name, file name, S3 bucket, loading method, row count, columns detected, measures, and dimensions.
- Keep the email notification option selected (and confirm the address) if you want to be told when processing finishes.
- Click Finish to validate the file and start processing.
What validation doesThe system checks your file against the pipeline configuration. Missing mapped columns fail the process; extra unmapped columns are safely ignored.
After processing: success or failure email
When processing finishes, Umbrella emails the address you configured.
-
On success, you'll get a confirmation that processing is complete, with shortcuts to Open Umbrella Cost or Create KPIs. You can now start monitoring metrics, creating KPIs, and scheduling the data for periodic loading.

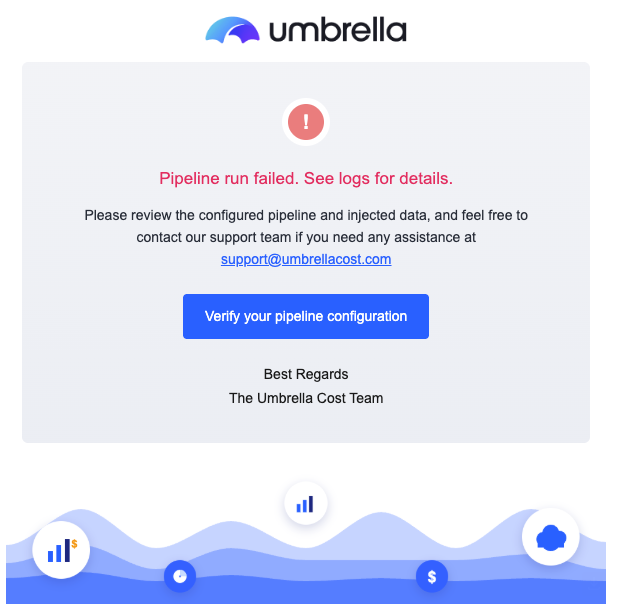
-
On failure, you'll get an email describing the issue with a Verify your pipeline configuration link, plus a path to support if you need help.
Load more data later
Once a pipeline exists, keep it fed via UI upload or the S3 file load.
- Update existing data by uploading the same dimensions + timestamp with new values.
- Delete data by sending the same time range with null values.
Limits and reference
| Item | Value |
|---|---|
| Measures per pipeline | Up to 5 |
| Custom dimensions per pipeline | Up to 5 |
| Required mappings | Datetime, Account ID, at least one Dimension |
| Aggregation functions | Sum, Average, Min, Max |
| Upload formats | CSV (UI), CSV/JSON |
| Max file size | 5 GB |
| Editable after creation | Pipeline name, dimension mapping, measure display names |
Editing Pipelines
Click the edit icon to modify the pipeline, including its name, column mappings, measure names, aggregation, unit, and category.

Manual Data injection
Upload data via the UI by clicking the icon and selecting a file.

Pipeline Data Validation
- The system checks your file against the pipeline configuration.
- Missing mapped columns will fail the process; extra unmapped columns are safely ignored.
Processing
Once validated, metrics data processing begins. You'll receive an email notification on success or failure.
Next stepOnce a pipeline is processing, build a KPI on its measures.